Karnaugh Maps Karnaugh Maps Karnaugh Map : a representation of the - - PDF document

karnaugh maps karnaugh maps
SMART_READER_LITE
LIVE PREVIEW

Karnaugh Maps Karnaugh Maps Karnaugh Map : a representation of the - - PDF document

Karnaugh Maps Karnaugh Maps Karnaugh Map : a representation of the truth table by a matrix of squares(cells) , where each square corresponds to a minterm ( or a maxterm) of the logic function. For n-variable function, we need 2^n rows


slide-1
SLIDE 1

1 Karnaugh Maps

Karnaugh Maps

◆ Karnaugh Map : a representation of the truth table by a

matrix of squares(cells) , where each square corresponds to a minterm ( or a maxterm) of the logic function.

◆ For n-variable function, we need 2^n rows truth table and

2^n squares(cells).

◆ The square number is equivalent to the row number in the

truth table

◆ To represent a logic function, the truth table values are

copied into their corresponding cells .

◆ The arrangements of the squares help to identify the input

variable redundancy ( X.Y.Z+X.Y.Z’=X.Y )

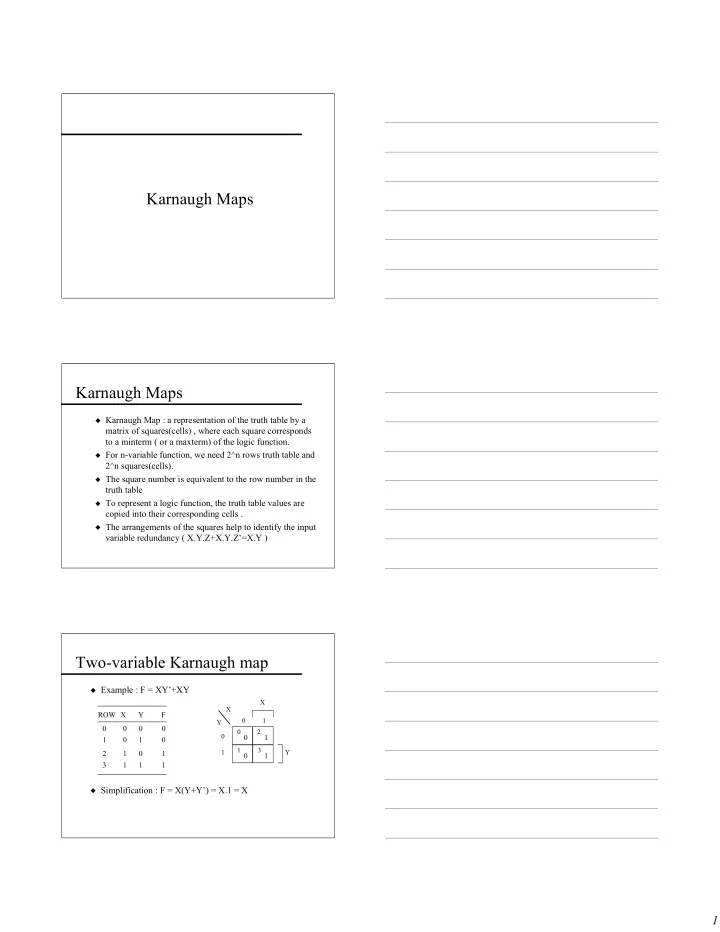
Two-variable Karnaugh map

◆ Example : F = XY’+XY ◆ Simplification : F = X(Y+Y’) = X.1 = X 1 3 2 X Y X Y

X Y F 1 1 1 1 1 1 1 1

1 1

ROW 1 2 3

slide-2
SLIDE 2

2

Three-variable Karnaugh map

◆ Example : F=X’.Y’.Z’+X’.Y’.Z+X.Y’.Z’+X.Y’.Z

Row X Y Z F 0 0 0 0 1 1 0 0 1 1 2 0 1 0 0 3 0 1 1 0 4 1 0 0 1 5 1 0 1 1 6 1 1 0 0 7 1 1 1 0

◆ F = X’.Y’.(Z’+Z)+X.Y’.(Z’+Z)=X’.Y’+X.Y’=(X’+X).Y’

= Y’

1 3 2 XY Z X Z

1 1

00 01 1 7 6 0 11 5 4 1

1

10 Y

Four-variable Karnaugh map

Row W X Y Z F 0 0 0 0 0 1 1 0 0 0 1 0 2 0 0 1 0 1 3 0 0 1 1 0 4 0 1 0 0 0 5 0 1 0 1 1 6 0 1 1 0 0 7 0 1 1 1 1 8 1 0 0 0 1 9 1 0 0 1 0 10 1 0 1 0 1 11 1 0 1 1 0 12 1 1 0 0 0 13 1 1 0 1 1 14 1 1 1 0 0 15 1 1 1 1 1

F= W’X’Y’Z’+W’X’YZ’+WX’YZ’+W’XYZ+WX’Y’Z’+WX’YZ’+WXY’Z+WXYZ

1 5 4 WX YZ W Z

1 1

00 01 00 13 120

1

11 9 8 1 10 X 3 2 6 7

1 1

14 151 10 110

1

01 11 10 Y

Five-variable Karnaugh map

◆ Five variable K-map is formed using two connected four-variable maps:

1 5 4 VWX YZ V Z 000 001 00 13 12 011 9 8 010 X 3 2 6 7 14 15 10 11 01 11 10 Y 16 17 21 20 29 28 25 24 19 18 22 23 30 31 26 27 100 101 111 110 W W X

slide-3
SLIDE 3

3

Dont Care Conditions :

◆ In some applications, the Boolean function for certain combinations of

the input variables is not specified. The corresponding minterms (maxterms) are called “dont care minterms(maxterms)”.

◆ In K-map , the “dont care minterms/maxterms” are represented by

“d”.

◆ Since the output function for those minterms(maxterms) is not

specified, those minterms(maxterms) could be combined with the adjacent 1 cells(0-cells) to get a more simplified sum-of-products (product-of-sums) expression.

Example

◆ Build a logic circuit that determines if a decimal digit is >= 5 ◆ Solution: ◆ - The decimal digits(0,1,2,...,9) are represented by 4 bit BCD code. ◆ - The logic circuit should have 4 input variables and one output. ◆ - There are 16 different input combinations but only 10 of them are

used.

◆ - The logic function should produce 0 if the number is <5 , and 1

if it is >= 5

Example - The Truth table

◆ The Truth table for the function is specified as follows:

Row W X Y Z F

0 0 0 0 0 0 1 0 0 0 1 0 2 0 0 1 0 0 3 0 0 1 1 0 4 0 1 0 0 0 5 0 1 0 1 1 6 0 1 1 0 1 7 0 1 1 1 1 8 1 0 0 0 1 9 1 0 0 1 1 10 1 0 1 0 d 11 1 0 1 1 d 12 1 1 0 0 d 13 1 1 0 1 d 14 1 1 1 0 d 15 1 1 1 1 d

slide-4
SLIDE 4

4

Timing Hazards

◆ The Truth Table determines the Steady State behavior of a

Combinational Logic Circuit

◆ Transient behavior :

  • Output could produce glitches when input variables change.
  • Glitches occur when the paths between inputs and output have

different delays.

  • Timing Hazards refer to the possibility of having glitches during

input transitions.

◆ Hazards :

  • Definitions.
  • Finding hazards.
  • Eliminating hazards.

Example

◆ F= YZ+XZ’ ◆ Delay in each gate is T . ◆ Input changes from XYZ=111 to 110 X Y Z F

X Y Z YZ Z’ XZ’ F T glitch