It Item em 9 9 - En Enroll llment Upd pdate Opt Out Channel - - PowerPoint PPT Presentation

it item em 9 9 en enroll llment upd pdate
SMART_READER_LITE
LIVE PREVIEW

It Item em 9 9 - En Enroll llment Upd pdate Opt Out Channel - - PowerPoint PPT Presentation

It Item em 9 9 - En Enroll llment Upd pdate Opt Out Channel CSR 38% IVR 28% Web 34% Eligible Opt Out % Opt Out Residential 56,000 1,284 2.3% Non-Residential 8,500 685 8.1% Total 65,000 1,969 3.0% Status Date: 7/11/18 1


slide-1
SLIDE 1

It Item em 9 9 - En Enroll llment Upd pdate

1

Status Date: 7/11/18

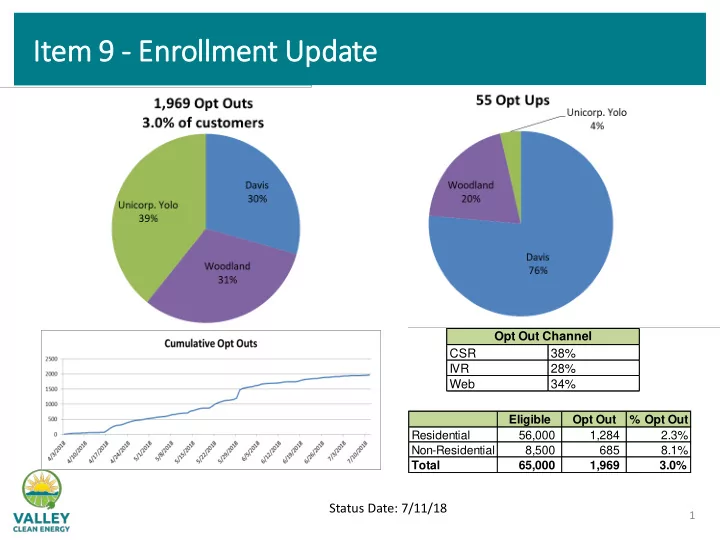
CSR 38% IVR 28% Web 34% Opt Out Channel Eligible Opt Out % Opt Out Residential 56,000 1,284 2.3% Non-Residential 8,500 685 8.1% Total 65,000 1,969 3.0%

slide-2
SLIDE 2

Item 12 – NEM Policy

July 12, 2018 Board Meeting Woodland, CA

slide-3
SLIDE 3

Background

  • VCE went through a lengthy process to approve the existing

NEM policy; used other CCA programs as models.

  • Current policy was reviewed by staff, CAC and was made

available to the public

  • Current policy requires monthly billing and an annual true-

up in April which is similar to most CCAs

  • Current policy pays customers 1 cent/kWh more than PG&E

for excess generation

  • Current policy designed to balance customer needs and the

cashflow requirements of VCE

  • The policy was approved on Feb 8, 2018 by the VCE Board
slide-4
SLIDE 4

CCA Excess Gen - Monthly Excess Gen - Annual True-Up Settlement Cash Out Limit

Peninsula Clean Energy Retail plus $0.01 Accumulated Credits April Monthly >$100 can elect cash

  • ut

MCE Retail plus deep green (currently $0.01) Accumulated Credits April Monthly >$100 can elect cash

  • ut

Sonoma Clean Power Retail plus $0.01 Accumulated Credits April Monthly >$100 can elect cash

  • ut

Cap on payout Silicon Valley Clean Energy Retail GreenPrime if enrolled Accumulated Credits April Monthly >$100 can elect cash

  • ut

Cap on payout Lancaster Choice Energy Retail Accumulated Credits Credit not applied if annual net generation is less than zero. October Monthly None – Always cashed

  • ut

Clean Power SF Retail Average retail rate April Monthly None PG&E Retail Wholesale, plus adder if given RECs Annual based

  • n enrollment

Annual, Monthly for some None Valley Clean Energy Retail plus $0.01 Wholesale plus $0.01, plus adder if given RECs April Monthly >$100 can elect cash

  • ut

CCA Policy Comparison - NEM

slide-5
SLIDE 5

NEM Feedback and Options

4

Local Solar community feedback raised concerns that some NEM customers could pay more in their first year of service Staff initiated an examination of the VCE NEM policy to see if changes were warranted To balance the objectives of simplicity and minimizing fiscal impacts, several options are being examined:

  • Existing policy with April true-up date and monthly billing
  • Move to the PG&E true-up date but retain monthly billing
  • Move to the PG&E approach—keep the existing true-up

date, with annual billing and a monthly payment option

  • Hybrids of the above
slide-6
SLIDE 6

PG&E NEM True-Up Dates by Month

Month NEM Anniversaries January 515 February 540 March 733 April 459 May 552 June 536 July 696 August 614 September 520 October 655 November 925 December 534

slide-7
SLIDE 7

Current NEM Policy Example

  • For a PG&E true-up date in September, this customer would pay

$480 by the VCE true-up date in April

  • Most customers would pay less, some would pay more
  • The customer would accrue $480 in additional credits over the

course of the summer and by the next true-up period would only owe $100

  • The customer would essentially be back on track, but would have

spent $480 out of pocket during the first year of VCE service

Example for September PG&E True-Up Under Current Model Jan Feb Mar April May June July Aug Sept Oct Nov Dec PG&E True-Up 100 $ VCE Bill 100 $ 100 $ 100 $ (120) $ (120) $ (120) $ (120) $ (120) $ 100 $ 100 $ 100 $ 100 $ Running Total 400 $ 500 $ 600 $ 480 $ 100 $ 200 $ 300 $

slide-8
SLIDE 8

PG&E Model

  • True-up month varies by customer and there will be true-ups every

month of the year

  • Customers are billed annually, although some are on monthly billing

cycles

PG&E Model Jan Feb Mar April May June July Aug Sept Oct Nov Dec Monthly Charges 100 $ 100 $ 100 $ 100 $ (120) $ (120) $ (120) $ (120) $ (120) $ 100 $ 100 $ 100 $ Annual True-Up 100 $

slide-9
SLIDE 9

Recommendation

Postpone NEM enrollment

  • Postpone NEM enrollment to 2019 (expected Q1 2019) to allow for

development/finalization of a modified policy and billing systems.

  • If Board approves postponement, direct staff to host public workshops

to provide information and receive public input on proposed changes to NEM policy.

slide-10
SLIDE 10

Policy Amendment Concepts - Discussion

Stay with the true-up schedule used by PG&E for the majority of existing NEM customers

  • This would be seamless to customers and they will receive VCE

benefits Shift some NEM customers to monthly billing

  • Shift the roughly 670 existing NEM customers (less than 10% of NEM

customers), who consistently owe more than $500/yr from an annual payment to monthly payments while maintaining their existing true-up date.

  • Allow staff to negotiate with Ag and commercial customers (less than

100 customers). New NEM Customers

  • New customers would be placed on annual billing and trued-up on the

month they become a NEM customer, unless annual true-up exceeds $500

slide-11
SLIDE 11

Financial Impacts—Net Position

  • The cumulative net impacts (3 years) show an estimated difference of

$895k when placing the >$500 customers on monthly billing

  • Revenues are not recorded until true-up

Scenario

# of Customers / % of NEM Customers

2018 ($1,000's) 2019 ($1,000's) 2020 ($1,000's) 2021 ($1,000's)

Cumulative Difference

Current NEM Policy

$ 2,071 $ 10,377 $ 17,927 $ 22,261

All NEM to Annual (same as PG&E)

$ 2,126 $ 9,431 $ 16,250 $ 20,622 $ 1,639

>$1000 annually 124 / 1.7% $ 2,126

$ 9,504 $ 16,508 $ 20,882 $ 1,379

>$750 annually 255 / 3.5% $ 2,126

$ 9,585 $ 16,703 $ 21,078 $ 1,183

> $500 annually 667 / 9.3%

$ 2,126 $ 9,767 $ 16,988 $ 21,366

$ 895

slide-12
SLIDE 12

Issues for Consideration

  • Keeping NEM program simple for customers (i.e. structure similar

to existing PG&E program)

  • Changes to VCE’s cash flow.
  • Proposed changes will require up-front costs to upgrade the

billing and back-office systems.

  • Changes may increase ongoing administrative costs for VCE by

having to support multiple true-ups per year rather than one time in April.

  • Changes will take time, delaying inclusion of NEM customers into
  • VCE. Existing NEM customers would need to stay with PG&E

while policies and processes are put in place.

  • Timing and cost of outreach to NEM customers.
  • Outreach to solar installers.
  • Other issues/ideas will arise—keeping it relatively simple may be

difficult.

slide-13
SLIDE 13

Proposed Next Steps

  • Schedule and conduct outreach to NEM customers/solar

installers in late July/early August

  • Finalize policy amendment concepts and present to the CAC at

their August meeting

  • Finalize policy amendment concepts and present to the Board for

approval at the September meeting

  • If Board approves recommendation, send 2 letters to all NEM

customers and contractors notifying them of the proposed changes—one for postponement (immediately), and one to notify

  • f revised policy when it is finalized (September)
  • Proceed with changes to billing/back-office systems if final policy

amendments are approved by the Board

  • Implement changes and enroll customers beginning in early 2019
slide-14
SLIDE 14

ValleyCleanEnergy.com

slide-15
SLIDE 15

Val alley Cle lean Energy In Integrated Resource Pl Plan an (IRP (IRP) Ad Adoption

July July 12, 12, 201 2018

1

It Item em 13 13 – IRP IRP Ado doptio ion

slide-16
SLIDE 16

Back ackground/Process

2

  • Integrated Resource Plan – Required by CPUC under SB

350 for all CCA’s (LSE’s)

  • Portfolio planning for years 2018-2030
  • Requires “preferred portfolio” to be identified by VCE
  • Requires Action Plan to ID proposed implementation steps
  • Updated every 2 years
  • Development of IRP
  • Public Workshop April 26 (hosted by CAC)
  • Community Advisory Committee Meetings: May 30 & July 2
  • Board Briefings/Direction: May 10 & June 6
  • Board Action: July 12
  • Submit to CPUC by August 1st; presentation to CPUC in early

August

slide-17
SLIDE 17

What’s New?

3

  • Reduced Number of Scenarios based on Board and CAC

Feedback

  • Base – 50% RPS, 75% clean
  • Cleaner Base –80% RPS, 100% clean (Recommended)
  • Local – 50% RPS, 75% clean, a more balanced local solar portfolio

with more projects in the 1-10 MW size range

  • Updated scenarios result in closer range for costs by 2030 and a

more plausible local portfolio

  • Revised action plan and prioritization based on CAC inputs
  • Board Actions:
  • Select Preferred Portfolio
  • Approve IRP
slide-18
SLIDE 18

Res esource Port

  • rtfoli

lio Gen Generatio ion Mix

4

slide-19
SLIDE 19

Es Estim imated Gen Generatio ion Cos

  • sts by Port
  • rtfoli

lio

5

slide-20
SLIDE 20

Not

  • tes on
  • n Res

esource Choi hoices

6

  • Biomass and Geothermal
  • Greenfield (new): Long lead-time with significant cost and risk

during development. Typically long permitting process. Scale is 50-200 MW, which could necessitate partnering where VCE would be a small part with limited influence over process & price.

  • Existing: Limited availability - price and availability to be

discovered in RFO.

Note: Despite high costs, baseload renewables may become necessary in the long term to manage load at high renewable energy penetration. Remote generation could be an option.

  • Solar PV. Likely the easiest local resource and very cost competitive

at 1MW and larger. Scalable but may conflict with agricultural and environmental interests. Diminishing value of solar as renewable portfolio grows owing to its inability to support night-time electric demand.

slide-21
SLIDE 21

Not

  • tes on
  • n Res

esource Choi hoices – Con

  • nt.

t.

7

  • Wind. Cost effective and has attractive profile relative to solar
  • generation. New wind projects are typically in the 50-200+ MW

range which would require partnering with others for the off-take. Limited incremental potential in California. Picking up smaller contracts with existing wind facilities may be a good match for VCEA’s size.

  • Storage. Increasingly cost effective. Costs expected to fall

throughout the forecast period. Qualifies for RA and Flexible Capacity requirements but cost-prohibitive for riding through non-solar hours.

slide-22
SLIDE 22

Not

  • tes on
  • n Portf
  • rtfoli

lio Choi hoices

8

  • Portfolio choices. The Base Portfolio is very similar in overall cost

to the Cleaner Base which has significantly higher percentage of

  • renewables. This result is driven by expected low costs for solar PV

relative to CAISO electricity prices and other renewables. Due to the high risk and high cost of baseload renewables such as biomass and geothermal, we propose VCEA focuses mainly on large scale solar and wind resources and explore local renewable projects if and when VCEA receives attractive offers from developers (through solicitation

  • r unsolicited)
  • By 2021, 65% of VCEA’s RPS energy must be met by resources under

long term contracts (approx. 161,500 MWh per year). This is approximately equivalent to:

  • 25MW biomass plant, OR
  • 55-60 MW wind farm, OR
  • 600+ Acres solar installation, OR
  • 150 commercial rooftop / parking lot solar systems

1

slide-23
SLIDE 23

Actio ction Plan Plan

9

Updates from last Board briefing on June 6th:

  • Placed into IRP Report format
  • Additional descriptive text for IRP Report
  • CAC edits and prioritization
  • Added evaluation of impacts of electrification on load forecast

Action Plan Key Elements:

1. Long term renewable procurement 2. Establish long term renewable energy and GHG targets for 2030 3. Key portfolio performance indicators 4. Evaluate impacts of electrification on load forecast 5. Evaluate impacts of climate change on load forecast 6. Evaluate options for assuming responsibility for energy efficiency / demand side programs from PG&E 7. Investigate non-battery storage technologies and demand response

  • ptions
slide-24
SLIDE 24

Rec ecommendatio ions

10

  • 1. Approve the Integrated Resource Plan (IRP) which includes the

“Cleaner Base” portfolio as the Preferred Portfolio and the associated Action Plan, for submission to the California Public Utilities Commission (CPUC).

  • 2. Authorize staff to make any non-substantial changes necessary

to finalize the IRP document for filing.