
SLIDE 1
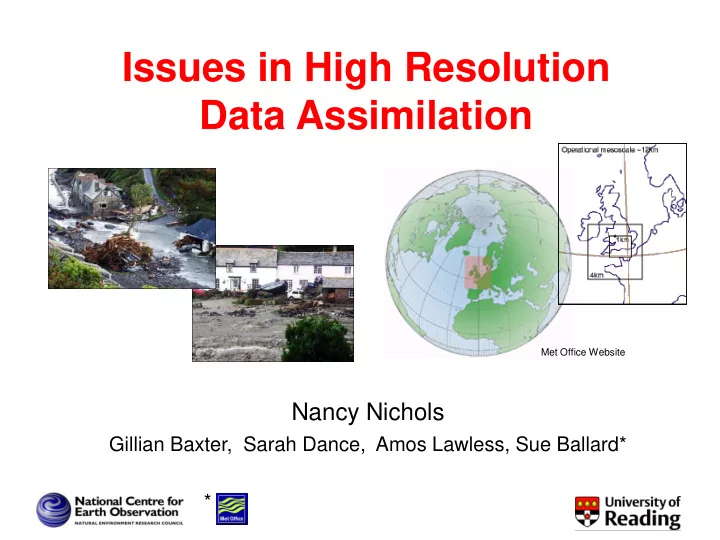
Issues in High Resolution Data Assimilation
Nancy Nichols
Gillian Baxter, Sarah Dance, Amos Lawless, Sue Ballard*
Met Office Website
Issues in High Resolution Data Assimilation Met Office Website - - PowerPoint PPT Presentation
Issues in High Resolution Data Assimilation Met Office Website Nancy Nichols Gillian Baxter, Sarah Dance, Amos Lawless, Sue Ballard* * NCEO: Delivering world-class science by unlocking the full potential of Earth Observation to monitor,
Met Office Website
Delivering world-class science by unlocking the full potential of Earth Observation to monitor, diagnose and predict environmental and climate change, and ensuring that scientific advances translate into public good.
Picture from Ross Bannister
Observations Data assimilation NWP model Hydrological model
Boscastle storm 2004
Leeds University bbc.co.uk
Heathrow fog, Christmas 2006 Birmingham tornado 2005
bbc.co.uk bbc.co.uk
Snow, 2009
) 16 sin( ) 8 sin( ) 2 sin( 2 ) 4 / sin( 2 truth x x x x
2 ~
| |
k
f
= diag{1.0,0.5,0.1,0.01,0.005} = diag{0.005,0.01,0.1,0.5,1.0}
1 2
I Σ
1
I Σ
1
I Σ
1
I Σ
1
LAM domain Power spectrum
Wave number Log (Power) Faster convergence at large and small scales Slower convergence at intermediate scales 1st iterate Final iterate
Bij =
Periodic Gaussian Exponential Laplacian 2nd Derivative Blue = no obs Red = with obs variances 0.1 / 0.2
N j j k
1 1 ^
j