
SLIDE 1
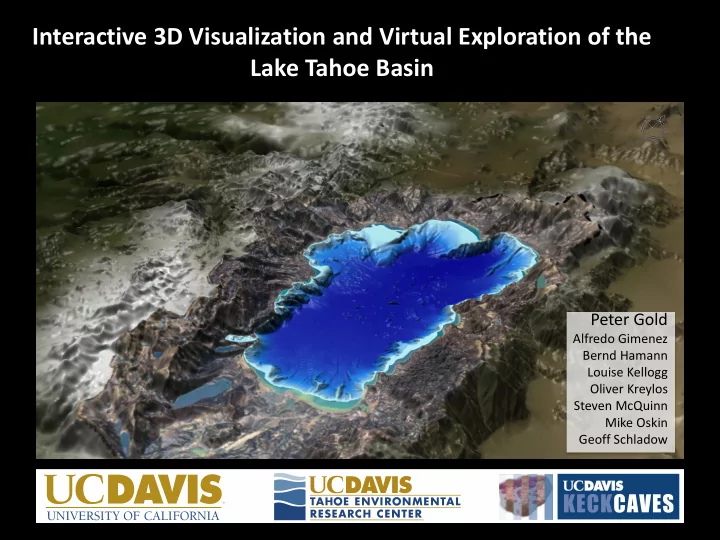
Interactive 3D Visualization and Virtual Exploration of the Lake Tahoe Basin
Peter Gold
Alfredo Gimenez Bernd Hamann Louise Kellogg Oliver Kreylos Steven McQuinn Mike Oskin Geoff Schladow
Interactive 3D Visualization and Virtual Exploration of the Lake - - PowerPoint PPT Presentation
Interactive 3D Visualization and Virtual Exploration of the Lake Tahoe Basin Peter Gold Alfredo Gimenez Bernd Hamann Louise Kellogg Oliver Kreylos Steven McQuinn Mike Oskin Geoff Schladow Purpose Present open source software tools
Alfredo Gimenez Bernd Hamann Louise Kellogg Oliver Kreylos Steven McQuinn Mike Oskin Geoff Schladow