
SLIDE 1
1
Insights into the Diagnosis and Management
- f SDB Utilizing Upper Airway Imaging
Richard J. Schwab, M.D. Professor of Medicine Division of Sleep Medicine Pulmonary, Allergy and Critical Care Division University of Pennsylvania Medical Center Philadelphia, Pennsylvania Insights into the Diagnosis and Management of SDB Utilizing Upper Airway Imaging - Disclosures
- NIH grants - RO1/PPG (Obesity and OSA)
- Consultant:
- Apnicure
- Foramis Medical Group
Insights into the Management of SDB Utilizing Upper Airway Imaging
- Physical examination/anatomic risk factors for OSA
- Upper airway imaging modalities
- MRI
- Drug induced endoscopy
- Treatment of sleep apnea
– CPAP – Weight loss – Oral appliances – Upper airway surgery
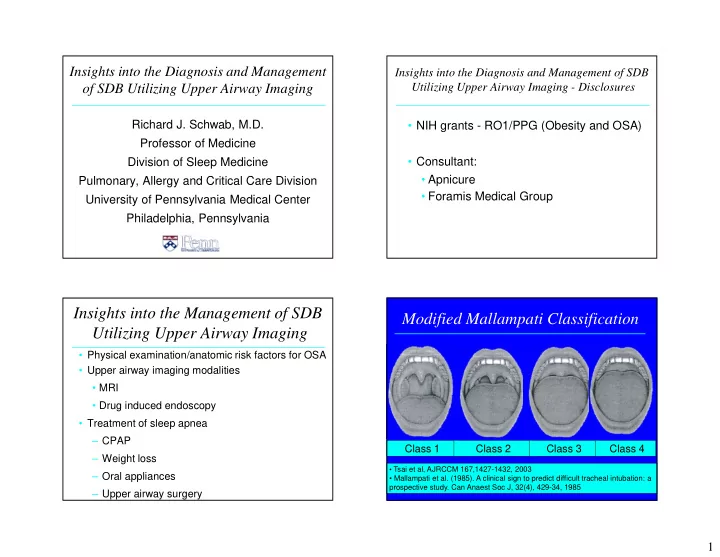
Modified Mallampati Classification
Class 1 Class 2 Class 3 Class 4
- Tsai et al, AJRCCM 167,1427-1432, 2003
- Mallampati et al. (1985). A clinical sign to predict difficult tracheal intubation: a
prospective study. Can Anaest Soc J, 32(4), 429-34, 1985