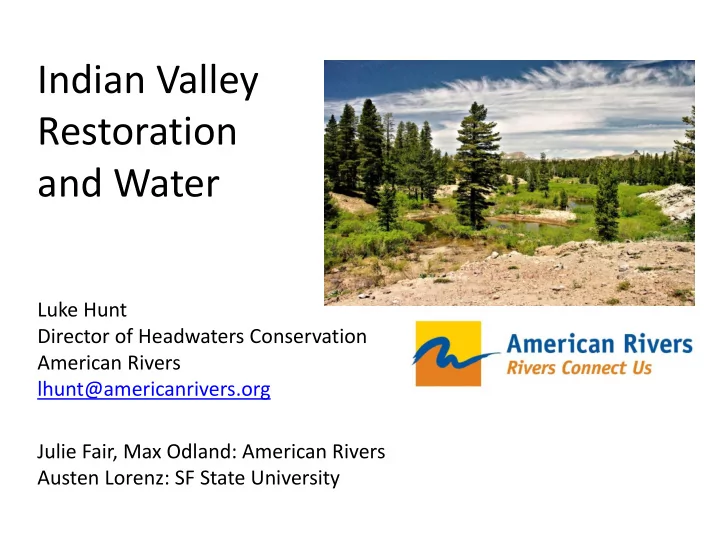

Indian Valley Restoration and Water Luke Hunt Director of Headwaters Conservation American Rivers lhunt@americanrivers.org Julie Fair, Max Odland: American Rivers Austen Lorenz: SF State University
Indian Valley 1. Flow 2. Groundwater 3. Damage and Recovery
Indian Valley 3.5 acres of pond 2.0 acres of fill 1.2 miles of channel
Upper Gauge 2 1 Stage (ft) 0 2 Lower Gauge 1 0 0 5 10 15 Discharge (cfs)
Upper Gauge 2 1 Stage (ft) 0 2 Lower Gauge 1 0 0 5 10 15 Discharge (cfs)
4 Upper Gauge 3 2 1 Stage (ft) 0 4 Lower Gauge 3 2 1 0 0 50 100 150 200 Discharge (cfs)
Annual Flow 100 Upper Gauge Lower Gauge 75 Discharge (cfs) 50 25 0 Apr Jan 2013 Jul Oct Jan 2014
Annual Flow 100 Upper Gauge Lower Gauge 75 Discharge (cfs) 50 25 0 Apr Jan 2013 Jul Oct Jan 2014
Summer Flow 10.0 Upper Gauge Lower Gauge Discharge (cfs) 5 0 Jun 01 Jul 01 Aug 1 Sep 01
Summer Flow 10.0 Upper Gauge Lower Gauge Discharge (cfs) Sink Source 5 0 Jun 01 Jul 01 Aug 1 Sep 01
2012 2013 10.0 ( Before Project) (After Project) 7.5 5.0 2.5 0.0 Discharge (cfs) Jul 01 Aug 01 Sep 01 2014 10.0 How Much? 7.5 When? 5.0 2.5 0.0 Aug 01 Sep 01 Jul 01
Difference (Outflow – Inflow) 2 2012 2013 ( Before Project) (After Project) 1 0 -1 Discharge (cfs) -2 Sep 01 Jul 01 Aug 01 2 2014 1 0 -1 -2 Sep 01 Jul 01 Aug 01
Year Snow Total Summer Crossover Date Meadow Subsidy Water Eq Inflow June-Sept (acre-ft) May 1 (in) June-Sept (acre-ft) (Outflow > Inflow) 2012 6/26 13 18.6 2.6 2013 6/17 10 19.9 5.4 2014 6/9 11.9 13.4 15.2
Year Snow Total Summer Crossover Date Meadow Subsidy Water Eq Inflow June-Sept (acre-ft) May 1 (in) June-Sept (acre-ft) (Outflow > Inflow) 2012 6/26 13 18.6 2.6 2013 6/17 10 19.9 5.4 2014 6/9 11.9 13.4 15.2
Year Snow Total Summer Crossover Date Meadow Subsidy Water Eq Inflow June-Sept (acre-ft) May 1 (in) June-Sept (acre-ft) (Outflow > Inflow) 2012 6/26 13 18.6 2.6 2013 6/17 10 19.9 5.4 2014 6/9 11.9 13.4 15.2
Year Snow Total Summer Crossover Date Meadow Subsidy Water Eq Inflow June-Sept (acre-ft) May 1 (in) June-Sept (acre-ft) (Outflow > Inflow) 2012 6/26 13 18.6 2.6 2013 6/17 10 19.9 5.4 2014 6/9 11.9 13.4 15.2
Year Snow Total Summer Crossover Date Meadow Subsidy Water Eq Inflow June-Sept (acre-ft) May 1 (in) June-Sept (acre-ft) (Outflow > Inflow) 2012 6/26 13 18.6 2.6 2013 6/17 10 19.9 5.4 2014 6/9 11.9 13.4 15.2 2015 0
Year Snow Total Summer Crossover Date Meadow Subsidy Water Eq Inflow June-Sept (acre-ft) May 1 (in) June-Sept (acre-ft) (Outflow > Inflow) 2012 6/26 13 18.6 2.6 2013 6/17 10 19.9 5.4 2014 6/9 11.9 13.4 15.2 2015 0
9/4/2012 Pre-Project Year Snow Water Eq May 1 (in) 2012 13 2013 10 2014 11.9 2015 0 8/15/15 9/10/15
Groundwater Depth Across Years 0 2 well 1 4 6 well 3 Depth (ft) Before After well 4 well 5 0 2 well 6 4 6 2011 2012 2013 2014 2015 2016
Groundwater Depth By Month Across Years 0 2 well 1 well 1 4 6 well 3 well 3 Depth (ft) well 4 well 4 well 5 well 5 0 2 well 6 well 6 4 6 Jun Jul Aug Sept Oct 2011 2012 2013 2014 2015 2016
Groundwater Depth Rise in Groundwater Level By Month after Project 2.1 ft well 1 0.7 ft well 3 well 4 0.7 ft 1.4 ft well 5 0.2 ft well 6 Jun Jul Aug Sept Oct
Coca-Cola Replenish Estimate Depth
Coca-Cola Replenish Estimate
Coca-Cola Replenish Estimate Depth/2 X Meadow Area
Coca-Cola Replenish Estimate Depth/2 X Meadow Area Replenish Volume = Depth/2 X Meadow Area X Specific Yield = 3 ft/2 X 500 ac X 0.33 = 225 acre ft
Indian Valley 3.5 acres of pond X 3’ deep 15 acres of floodplain X 1.5’ 8 acres of floodplain X .7’ 15-20 acre feet
Year 1 Damage 100 75 50 25 0 Apr Jan 2013 Jul Oct Jan 2014
200 Flood 7/26/2013 150 Discharge (cfs) Peak Flow: Upper Ga.= 100cfs Lower Ga.= 180cfs 100 1.5 hours > 20 cfs 50 ~8,000 cuft of sediment in 0 uppermost pond 00:00 06:00 12:00 18:00
2013 2013
2013 2013 2015
2013 Half-way through project reach 2015
2013 Bottom of project 2015
Take homes: 1. Meadow soaks up water in spring, releases in summer. 2. Restoration increased summer outflows. 3. Net effect spring-summer is to reduce volume. 4. Groundwater elevated 1-2 feet. Narrow area affected. 5. Greatly increased summer aquatic habitat --- pools vs dry 6. Rapid sedimentation.
Thanks! Chuck Loffland, Rick Hopson: USFS Alpine Watershed Group staff and volunteers Jim Wilcox and Terry Benoit: Plumas Corporation Austen Lorenz: San Francisco State Sierra Nevada Alliance Americorps Program Julie Fair, Max Odland: American Rivers NFWF, the CA LCC and Coca-Cola provided essential funding.
Recommend
More recommend