imaging impact damage in high aspect ratio composite
play

IMAGING IMPACT DAMAGE IN HIGH ASPECT RATIO COMPOSITE PLATES J.Rouse - PDF document

18 TH INTERNATIONAL CONFERENCE ON COMPOSITE MATERIALS IMAGING IMPACT DAMAGE IN HIGH ASPECT RATIO COMPOSITE PLATES J.Rouse 1 , R.Bradley 2 , P.J.Withers 2 , 1 Northwest Composites Centre, School of Materials, University of Manchester, UK 2 Henry


  1. 18 TH INTERNATIONAL CONFERENCE ON COMPOSITE MATERIALS IMAGING IMPACT DAMAGE IN HIGH ASPECT RATIO COMPOSITE PLATES J.Rouse 1 , R.Bradley 2 , P.J.Withers 2 , 1 Northwest Composites Centre, School of Materials, University of Manchester, UK 2 Henry Moseley X-Ray Imaging Facility, School of Materials, University of Manchester, UK Keywords Impact; Damage; X-ray tomography; detector can be magnified by varying R 1 and R 2 . 1 Introduction The magnification, M, is given by: Three-dimensional x-ray computed tomography (CT) is an excellent method for M = (R 1 + R 2 )/ R 1 (1) investigating the internal damage in engineering Resolutions on the system used in this components. The method provides a non- study (Nikon Metrology 225kV) are possible 
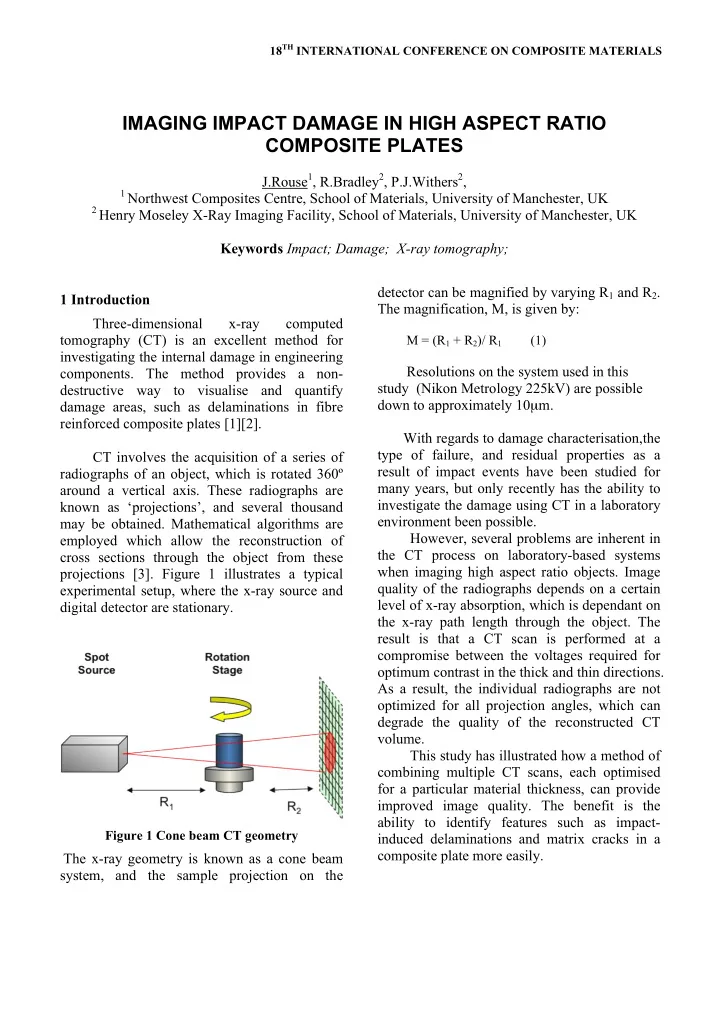
destructive way to visualise and quantify down to approximately 10 µ m. damage areas, such as delaminations in fibre reinforced composite plates [1][2]. With regards to damage characterisation,the type of failure, and residual properties as a CT involves the acquisition of a series of result of impact events have been studied for radiographs of an object, which is rotated 360º many years, but only recently has the ability to around a vertical axis. These radiographs are investigate the damage using CT in a laboratory known as ‘projections’, and several thousand environment been possible. may be obtained. Mathematical algorithms are However, several problems are inherent in employed which allow the reconstruction of the CT process on laboratory-based systems cross sections through the object from these when imaging high aspect ratio objects. Image projections [3]. Figure 1 illustrates a typical quality of the radiographs depends on a certain experimental setup, where the x-ray source and level of x-ray absorption, which is dependant on digital detector are stationary. the x-ray path length through the object. The result is that a CT scan is performed at a compromise between the voltages required for optimum contrast in the thick and thin directions. As a result, the individual radiographs are not optimized for all projection angles, which can degrade the quality of the reconstructed CT volume. This study has illustrated how a method of combining multiple CT scans, each optimised for a particular material thickness, can provide improved image quality. The benefit is the ability to identify features such as impact- Figure 1 Cone beam CT geometry induced delaminations and matrix cracks in a composite plate more easily. The x-ray geometry is known as a cone beam system, and the sample projection on the

  2. Unidirectional carbon fibre reinforced The standard deviation for T can be calculated plastic (CFRP) has been studied in this paper. by combining the errors in N tot and N ref , which The material under examination is MTM-45 for large photon counts (i.e. Gaussian manufactured by Advanced Composites Group distribution), is given by: (Heanor, UK). tot ref 2 T 1 T + σ 2 Theoretical Background to Dual Energy (5) σ T = tot tot Approach ref N ref N 2.1 Optimizing Signal to Noise Ratio The reference image is typically an average of Each spectral component of a polychromatic x- a number of exposures in order to reduce the ray beam is exponentially attenuated, resulting image noise σ tot ref . in the number of photons N reaching the The polychromatic absorbance is A =-ln( T ) detector being: and has standard deviation: (2) ⎛ ⎞ tot 2 ref σ A = σ T 1 T + σ 1 ⎜ ⎟ (6) Where λ is the x-ray wavelength, N ref is the T = ⎜ ⎟ tot tot ⎜ ⎟ number of photons when no object is present ref N ref N ⎝ ⎠ (i.e. white reference), μ abs is the absorption coefficient, and the integral is over the path l The signal to noise ratio for the radiographs is through the object . N ref takes into account the therefore given by: source spectrum and the detection efficiency at each wavelength. The number of detected photons at each (7) wavelength can be modelled as a Poisson distribution, and since the sum of independent Poisson distributed random variables also Reconstruction using the Feldkamp-Davis- follows the Poisson distribution so does the total Kress cone-beam algorithm [3] has a detected counts (summed over all wavelengths): backprojection step, involving summing absorbances after applying a Fourier filter, so (3) the reconstruction noise is related to that in A . In the simplest case, where the white reference For a Poisson distribution with mean N tot , the has the same noise as the radiographs (reference standard deviation is given by the square root of is obtained from a single exposure): N tot , and the probability distribution tends to the normal (Gaussian) distribution. The transmittance for the polychromatic A tot T ref ln( T ) (8) 1 + T = − N case is given by T : σ A (4) This function varies with T as shown in figure 2. It can be seen that the SNR has a peak at

  3. IMAGING IMPACT DAMAGE IN HIGH ASPECT RATIO COMPOSITE PLATES T=0.109, i.e. approximately 11% beam is achieved by calculating the actual path length transmission. l for each pixel in the radiographs taken during the CT scan. 3 Experimental 3.1 Beam Hardening Measurements In order to determine the beam hardening correction coefficients of the MTM-45 material, a step-wedge was manufactured as shown in figure 3. A panel was manufactured from 10 plies in a 0/90 symmetrical and balanced lay-up (autoclaved cured at 180ºC for 2 hours). The panel was sectioned with a diamond saw to give Figure 2 SNR as a function of transmittance when the noise in the white reference is equal to that in the 9 steps of material thickness, ranging from 1 radiographs mm to 256 mm. Each step doubles in thickness from the previous one. It can therefore be supposed that for an object with a high aspect ratio, the optimum SNR for the maximum and minimum material thicknesses would occur at drastically different beam energies. By correcting for beam hardening effects, two CT scans performed at two beam energies can be combined to give improved SNR for a high aspect ratio object. 2.2 Beam Hardening The Nikon Metrology 225kV CT system Figure 3 CFRP Step Wedge, with thicknesses ranging used in this study generates a polychromatic from 1mm to 256mm beam of x-rays, which results in a phenomenon known as beam hardening . The absorption Radiographs were taken of each step at coefficient, µ abs , of a material generally voltages ranging from 40 kV to 225 kV in 10 decreases with increasing x-ray energy; the kV increments. Absorbance curves were then absorbance is therefore a non-linear function of generated from these images to give the distance through the material, l , as shown by relationships between absorbance and material Equation 2. thickness over a range of voltages. Fitting a third order polynomial to these curves gives the beam hardening calibration curve. Figure 4 By determining the absorbance, A , illustrates absorbance versus thickness plots for experimentally over a range of thickness and 40 kV, 80 kV and 120 kV along with associated voltage, polynomial calibration curves to correct beam hardening correction equations. for beam hardening can be obtained. Correction 3

Download Presentation
Download Policy: The content available on the website is offered to you 'AS IS' for your personal information and use only. It cannot be commercialized, licensed, or distributed on other websites without prior consent from the author. To download a presentation, simply click this link. If you encounter any difficulties during the download process, it's possible that the publisher has removed the file from their server.

Recommend


More recommend