
SLIDE 1
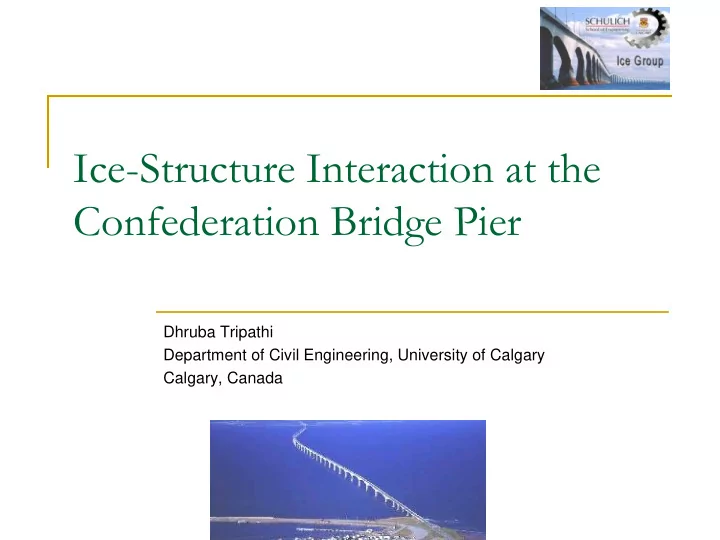
Ice-Structure Interaction at the Confederation Bridge Pier
Dhruba Tripathi Department of Civil Engineering, University of Calgary Calgary, Canada
Ice-Structure Interaction at the Confederation Bridge Pier Dhruba - - PowerPoint PPT Presentation
Ice-Structure Interaction at the Confederation Bridge Pier Dhruba Tripathi Department of Civil Engineering, University of Calgary Calgary, Canada Overview Confederation Bridge Introduction Monitoring Direct, indirect, and
Dhruba Tripathi Department of Civil Engineering, University of Calgary Calgary, Canada
5/18/2010 Tripathi 2
Confederation Bridge Introduction Monitoring – Direct, indirect, and observations Pressure panels Data analysis
Activation Analysis Detailed Pressure Distribution Analysis Correlation Analysis
Conclusion
5/18/2010 Tripathi 3
5/18/2010 Tripathi 4
12.9 km long 100 years design life 40 m above water
4.5m to14m deep precast
Bridge Footings- Gravity
5/18/2010 Tripathi 5
Direct measurement
Indirect measurement
Observation of ice
Tilt meters measure
Stiffness of the pier
5/18/2010 Tripathi 6
5/18/2010 Tripathi 7
Limit stress (ice failure)
Vertical structures – Crushing failure of ice Conical ice shield – flexural failure –
causes lower load
Limit force (ice driving force)
5/18/2010 Tripathi 8
Computers at the bridge can
Ice load – live chart at
Real-time access - videos
5/18/2010 9 Tripathi
5/18/2010 Tripathi 10
20 panels Covering 40m2
5/18/2010 Tripathi 11
20 19 18 17 16 15 14 13 12 11 10 9 8 7 6 5 4 3 2 1 A total of 160
5/18/2010 Tripathi 12
8 sectors
~ 30 button on
2 buttons
Best represents
120 channels – upper cone (level ice and
40 channels – lower cone (Thick ice) 64 channels – pier shaft (Large keels) Tiltmeter data – Global ice force
4 time-lapse video data, upward-looking
5/18/2010 Tripathi 13
5/18/2010 Tripathi 14
STRUCTURE ICE Pressure zones (hpz)
5/18/2010 Tripathi 15
Electrical signals
Average data- every 17 seconds
Full Ice season – continuous
Triggered data- every 34
5/18/2010 Tripathi 16
4 panels and 10 sectors 42 sectors bad in
7 panels and 16 sectors 72 sectors bad in
5/18/2010 Tripathi 17
1 2 3 4 5 6 7 8 9 10 11 12 13 14 15 16 17 18 19 20 21 22 23 24 25 26 27 28 29 30 31 32 33 34 35 36 37 38 39 40 41 42 43 44 45 46 47 48 49 50 51 52 53 54 55 56 57 58 59 60 61 62 63 64 65 66 67 68 69 70 71 72 73 74 75 76 77 78 79 80 81 82 83 84 85 86 87 88 89 90 91 92 93 94 95 96 97 98 99 100 101 102 103 104 105 106 107 108 109 110 111 112 113 114 115 116 117 118 119 120
Events selection
Ice forces – (tiltmeter data) Availability of pressure panel data Video analysis, when available
Panels
Panels on cone for interaction of level ice Waterline panels – level ice impact Panels above water-line – Rubble piles
5/18/2010 Tripathi 18
5/18/2010 Tripathi 19
89 90 109 110 93 94 113 114
0.5 1 1.5 2 2.5 09:04.3 09:13.0 09:21.6 09:30.2 09:38.9 09:47.5 09:56.2 10:04.8
Time stamp (min.) Pressure, yip (MPa)
89 90 109 110 93 94 113 114 LEGEND
Unrealistic negative pressure Baselines differ in different channels Clear pressure peaks (sustained
Baselines changed over time
5/18/2010 Tripathi 20
5/18/2010 Tripathi 21
5/18/2010 Tripathi 22
5/18/2010 Tripathi 23
5/18/2010 Tripathi 24
5/18/2010 Tripathi 25
Sector considered active [pressure peak] > [a
Peaks – supported by at least 5 adjacent peaks in
5/18/2010 Tripathi 26
5/18/2010 Tripathi 28
89 90 109 110 93 94 113 114
5/18/2010 Tripathi 29
1 2 3 4 5 09:09.3 09:11.9 09:14.4 09:17.0 09:19.6 09:22.2 09:24.8 09:27.4 09:30.0 09:32.5 09:35.1 09:37.7 09:40.3 09:42.9 09:45.5 09:48.0 09:50.6 09:53.2 Panel Activation (No.) 0.1 0.2 0.3 0.4 0.5 0.6 Integrated Load (MN) Panel Activation Integrated Load
Integrated load =∑[ yi ai cos(αi)]
89 90 109 110 93 94 113 114
5/18/2010 Tripathi 30
5/18/2010 Tripathi 31
5/18/2010 Tripathi 32
Tripathi 33 89 90 109 110 93 94 113 114
1 2
12:09
Sector Pressure (MPa) Time (HH:MM) Sector 89
1 2 12:09
Time (HH:MM) Sector Pressure (MPa)
Sector 90
1 2 12:09
Sector Pressure (MPa) Time (HH:MM)
Sector 93
Sector 94
1 2 12:09
Time (HH:MM) Sector Pressure (MPa)
5/18/2010
5/18/2010 Tripathi 34
5/18/2010 Tripathi 35
5/18/2010 Tripathi 36
81 82 83 84 85 86 89 90 81 82 83 84 85 86 89 90
0.2 0.4 0.6 0.8 1
Correlation Coefficient S e c t
s
81 82 83 84 85 86 89 90
5/18/2010 Tripathi 37
Pressure panels readings -
Many of the sectors were
Availability of video data at
5/18/2010 Tripathi 38
Test the results by using
Process limit driving
Add some more events
May 29, 2009 39