
SLIDE 1
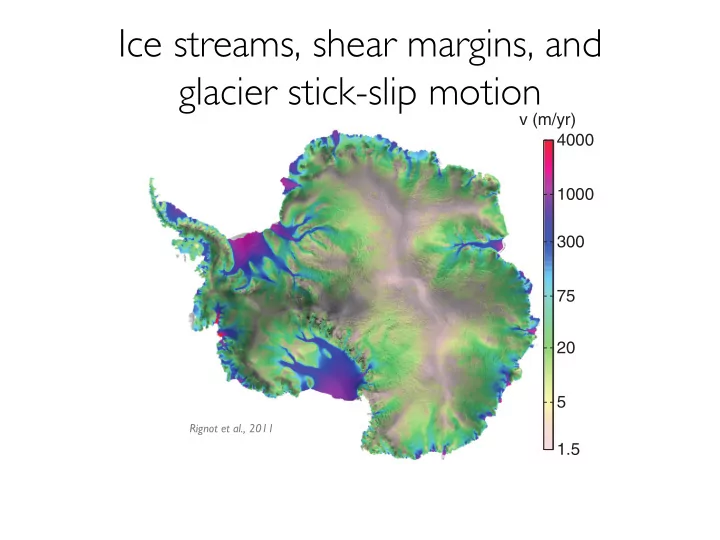
Ice streams, shear margins, and glacier stick-slip motion
a
v (m/yr) 1.5 5 20 75 300 1000 4000
Rignot et al., 2011
Ice streams, shear margins, and glacier stick-slip motion v (m/yr) - - PowerPoint PPT Presentation
Ice streams, shear margins, and glacier stick-slip motion v (m/yr) 4000 1000 300 75 20 5 a Rignot et al., 2011 1.5 Part 1. Background on ice streams 2 Ice Stream Ice Ridge Ice Ridge Ice Stream Ice Shelf Ice Ridge How certain is
a
v (m/yr) 1.5 5 20 75 300 1000 4000
Rignot et al., 2011
2
Ice Ridge Ice Stream Ice Ridge Ice Ridge Ice Stream Ice Shelf
Mass in 15 Ice Streams 1 km thickness 50 km width 1 km/yr flow velocity (other smaller mass fluxes, see Shepherd et al., 2012) Mass out Mass imbalance Imbalance is equal to the discharge of just two ice streams. How sure are we that this calculation will remain the same?
9
a
v (m/yr) 1.5 5 20 75 300 1000 4000
b
1.5 5 20 75 300 1000 4000
α (Pa yr/m)1/2 50 100 150
Morlighem et al. 2013 Model Observed Tuned “Basal Sliding Parameter”
physical processes.
conditions, but
Direction of ice flow 800 m ice thickness 120 km ice stream width x y z Bed Ice z x
Rapid ice velocities are primarily controlled by subglacial conditions.
Basal Shear Stress
Direct observation of the ice-bed interface: the WISSARD experiment
11
JPL Photo
GPS stations Floating Ice Grounded Ice ˚ ˚ ˚ 1 7 ˚ W ˚ ˚W ˚ ˚ ˚ ˚ ˚ ˚ ˚ ˚
Direct observation of the ice-bed interface: the WISSARD experiment
12
JPL Photo
Image Width ~ 0.15 m
GPS stations Floating Ice Grounded Ice ˚ ˚ ˚ 1 7 ˚ W ˚ ˚W ˚ ˚ ˚ ˚ ˚ ˚ ˚ ˚
13
JPL Photo
Image Width ~ 0.15 m
Fast flowing ice streams exist because of the lubricating effect of a water-saturated subglacial till. Direct observation of the ice-bed interface: the WISSARD experiment
Ice Ridge Ice Stream Ice Ridge Ice Ridge Ice Stream Ice Shelf Shear Margin
Shear margins are the lateral boundaries of the ice
15
Suckale et al 2014
16
Suckale et al 2014
The shear margin velocity gradient causes shear heating.
17
18
19
20
180˚ 180˚ 1 7 ˚ W 1 7 ˚ W 160˚W 160˚W 1 5 ˚ W 1 5 ˚ W 5 8 ˚S 8 5 ˚ S 4 8 ˚S 8 4 ˚ S 3 8 ˚S 8 3 ˚ S GPS stations Floating Ice Grounded Ice ˚ ˚ ˚ 170˚W ˚ ˚W ˚ ˚ ˚ ˚ ˚ ˚ ˚ ˚ GPS stations Floating Ice Grounded Ice ˚ ˚ ˚ ˚ ˚ 160˚W ˚ ˚ ˚ ˚ ˚ ˚ ˚ ˚
21
Beem et al. 2014 2018
Sliding Velocity (mm/s)
0.2 0.4 0.6 0.8 1
180˚ 180˚ 170˚W 170˚W 160˚W 160˚W 1 5 ˚ W 1 5 ˚ W 5 8 ˚S 8 5 ˚ S 4 8 ˚S 8 4 ˚ S 3 8 ˚S 8 3 ˚ S
˚ ˚ ˚ 1 7 ˚ W ˚ ˚ ˚ ˚ ˚ ˚ ˚ ˚ ˚ ˚
Floating Ice G r
n d e d I c e Direction of ice flow Total duration of sliding is 30 min.
24
Winberry et al., 2014
μ
1000 2000 3000 4000
GPS velocity (m/d)
10 20 30 40 50 60
Vmax ~50 m/d initial acceleration (~200 s) gradual deceleration (~1500 s)
Time (s) μ (a) M7 slip event (GPS data)
GPS Velocity (m/day)
26
Time (s) Particle Velocity (nm/s)
500
Data from IRIS
Jan 12 Jan 13 Jan 14 Sliding Velocity (m/day)
Seismic Particle Velocity (nm/s)
500
Grounding Zone
0 s 1000 s 2000 s 3000 s
Long term goal: to quantify the processes that determine the strength of the ice-bed interface. I validate an improved glacier sliding law against two observations:
μ
1000 2000 3000 4000
GPS velocity (m/d)
10 20 30 40 50 60
Vmax ~50 m/d initial acceleration (~200 s) gradual deceleration (~1500 s)
Time (s) μ (a) M7 slip event (GPS data)
Upstream station Downstream station Flow direction
Ice compresses in the upstream direction Steady upstream motion Minimal downstream motion
During a slip event, ruptures propagate across the ice stream. Direction of slip Direction of rupture propagation
During a slip event, ruptures propagate across the ice stream. Not yet sliding Rupture front Direction of slip Sliding
The slip events ends when accumulated strain has been relieved.
Push from upstream ice Ocean Tides (Elastic) Shearing Basal shear acts everywhere x y Direction
ice flow
33
GPS stations Floating Ice Grounded Ice 180˚ 180˚ 1 7 ˚ W 1 7 ˚ W 1 6 ˚ W 1 6 ˚ W 150˚W 150˚W 5 8 ˚ S 85˚S 4 8 ˚ S 84˚S 3 8 ˚ S 83˚S
34
Our simplified ice sheet model represents a depth integrated, cross- stream profile of an ice stream. Inertia plays only a limited role in our simulations, but including it serves as a check on our predictions. Most of the interesting dynamics come from the basal shear stress term.
During sliding with Coulomb Friction, the frictional coefficient instantaneously jumps from a static to a dynamic value.
𝜐 = 𝑔 𝜏
Coulomb Friction cannot explain the re-strengthening that causes repeatable slip events and leads to numerical ill-posedness due to the infinitely sharp transition in strength.
Sliding Velocity Friction Coefficient Time V1 Static coefficient
Dynamic coefficient
36
We use a Rate- and State- Dependent Frictional sliding law. Important properties: 1. An instantaneous strength increase during acceleration (a stabilizing feature), 2. Evolution to a steady state value over a slip scale L. Sliding is said to be rate weakening if b>a.
Sliding Velocity Friction Coefficient ~ a Normalized Slip, u/L ~ b V1 V0
1 2 3 4
37
size of the sheared material.
Traditional glacier sliding laws (i.e., Weertman, 1957) are inconsistent with stick slip cycles. Stick-slip in the presence of steady loading requires a basal sliding law that results in cyclic acceleration and deceleration. Importantly, traditional glacier sliding laws exhibit unrealistic unbounded strength and may therefore
forces that favore ice acceleration.
Log ( ) Shear Stress Log ( ) Sliding Velocity
The transition between steady sliding and stick-slip occurs because of a balance between frictional weakening and elastic restoring force:
Friction Coefficient ~ a Normalized Slip, u/L ~ b
1 2 3 4
Slip Stress
39
40 50 100 150 200 500 1000 500 1000
Time (s)
1 2 3 50 100 150 200 250
Time (s)
5 10 15 50 100 150 200 100 200 20 40 60
Time (hr)
0.01 0.02 0.03
Velocity (mm/s)
50 100 150 200 20 40 60
Time (hr)
A. B. C. D. E. F.
Distance (km) Distance (km) Distance (km)
W/Wc = 2.0 W/Wc = 1.1 W/Wc = 0.8 100 km 125 km 150 km
Time (s)
Smooth tidal modulation Whillans-style slip event Inertially-limited slip event
Slow slip events happen in a unique range of parameter space:
Whillans Ice Plain: “Slow-Slip”
Quasi-steady tidal modulation Inertial rupture
High pore pressure Low pore pressure
frictional weakening due to sliding > elastic resistance to slip
Absolute strength and weakening rate both depend on effective pressure.
depends on water pressure Also depends on water pressure
Details: The critical pore pressure p∗ results from a linear stability analysis of perturbations to steady frictional sliding with rate and state friction (see, for example Rice et al., 2001; Lipovsky and Dunham, 2016).
?
Basal Resistive Stress > Driving Stresses
0.1 0.2 0.3 0.4 0.5 500 1000 1500 2000
Time (s)
0.1 0.2 0.3 0.4 0.5
Sliding Velocity (mm/s) Sliding Velocity (mm/s)
GPS stations Floating Ice Grounded Ice 1 8 ˚ 1 8 ˚ 170˚W 170˚W 160˚W 160˚W 1 5 ˚ W 1 5 ˚ W 5 8 ˚ S 8 5 ˚ S 4 8 ˚ S 8 4 ˚ S 3 8 ˚ S 8 3 ˚ S
Direction of ice flow 43
Rupture propagation occurs as the onset of slip moves from one weakening zone to another.
44
We still have not addressed the details of the weakening zones…
Seismic Particle Velocity (nm/s)
500
Surface Velocity (m/day)
0 s 1000 s 2000 s 3000 s
46
Same log-power color-scale in both figures
Simulation Data
GPS Data GPS Data
Frequency
1/T 2/T 3/T 4/T
…
Power
…
Time
Amplitude T
…
T T T T
Frequency
1/T 2/T 3/T 4/T
…
Power
…
Time
Amplitude T
…
T T T T 100 nm/s Lipovsky and Dunham, 2016
Whillans Ice Plain, ~120 km cross stream Lipovsky and Dunham, 2016
Strain Accumulation
No slip
Steady slip Steady slip
Most strain in the bed Limited strain in ice
Whillans Ice Plain, ~120 km cross stream Lipovsky and Dunham, 2016
Slip
More elastic rebound Less elastic rebound
Whillans Ice Plain, ~120 km cross stream Lipovsky and Dunham, 2016
Net Motion Over Cycle
Net displacement No net displacment
Models of tremor episodes reveal a tremendous amount of information about subglacial conditions:
Net displacement No net displacment
No slip
More elastic rebound Less elastic rebound
Steady slip Steady slip
Most strain in the bed Limited strain in ice
Lipovsky and Dunham, 2016
Surface Velocity (m/day) Time (s)
Slip = Velocity x Recurrence Time ~ 50 microns
Elastic Whole Space Bimaterial Interface
56
Rogers and Dragert (2003)
57
Liu and Rice (2008)
100 m scale 100 km scale
59
Winberry et al., 2014
60
Mechanical and hydrologic properties of Whillans Ice Stream till: Implications for basal strength and stick-slip failure
1Department of Geoscience, Penn State, University Park, Pennsylvania, USA
Details: The change in the bed effective shear modulus can be computed through an effective medium (e.g.., Voight-Reuss) description. The shear modulus is inversely related to the porosity because bulk averge shear modulus decreases when there is a higher water fraction.
Dilatancy during rapidly sliding phase Compaction during stick-phase
61
Recent (post-2010) style Long Wait Time > 18 hr Past (pre-2010) style: Short Wait Time < 18 hr Shear modulus inferred from models of small, repeating earthquakes (Lipovsky and Dunham, 2016)
Bed Shear Modulus, MPa 10 20 30 Frequency