
SLIDE 1
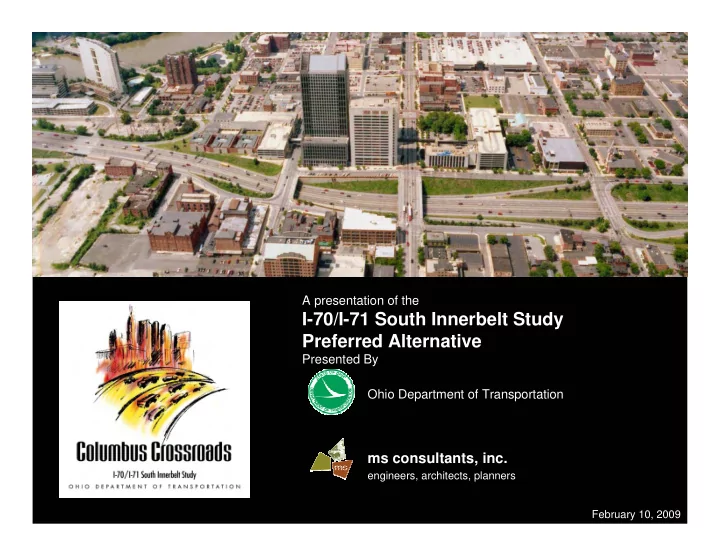
A presentation of the
I-70/I-71 South Innerbelt Study Preferred Alternative
Presented By Ohio Department of Transportation
ms consultants, inc.
engineers, architects, planners February 10, 2009
I-70/I-71 South Innerbelt Study Preferred Alternative Presented By - - PowerPoint PPT Presentation
A presentation of the I-70/I-71 South Innerbelt Study Preferred Alternative Presented By Ohio Department of Transportation ms consultants, inc. engineers, architects, planners February 10, 2009 H i s t o r y I-70/71 Planned in the 1950s
A presentation of the
I-70/I-71 South Innerbelt Study Preferred Alternative
Presented By Ohio Department of Transportation
ms consultants, inc.
engineers, architects, planners February 10, 2009
I-70/71 Planned in the 1950s Capacity of 125,000 vehicles per day Constructed in the 1960s
High Crash location – on average 2 to 3 crashes per day Freeway carries 175,000 vehicles per day
Preferred Alternative selected using input from:
A Stakeholder Committee of about 50 downtown
More than 250 community meetings, and using Thousands of public comments
February 2003
February 2003
February 2003
February 2003
Both alternatives:
Untangle the I-70 and I-71 overlap so motorists
don’t have to make multiple lane changes
Add lanes to accommodate traffic growth Consolidate ramps to improve safety
Before – looking east from High Street
After – looking east from High Street
Before – looking east toward Third & Fourth Streets
After – looking east toward Third & Fourth Streets
Existing view looking north toward Spring & Long Street
Church Before - looking north toward Spring and Long streets
One-Way Avenue view looking north toward Spring & Long Street
After - looking north toward Spring and Long streets
Church
The analysis showed differences in the following factors:
Impacts to historic districts* Spacing of intersections to improve traffic flow Economic development opportunities (City Study)
These factors all favor the Mound-Fulton Alternative
* Federal laws specifically protect historic resources and require agencies to avoid them when there are prudent and feasible alternatives.
Brewery District – Fulton-Livingston Alternative
Brewery District – Mound-Fulton Alternative
German Village – Fulton-Livingston Alternative
German Village – Mound-Fulton Alternative
Fulton-Livingston Alternative
Mound-Fulton Alternative
Fulton-Livingston Alternative
Mound-Fulton Alternative
An economic analysis initiated by Columbus concluded Mound-Fulton provided more
development
Long Street Crossing Today
Long Street crossing today
Long Street crossing
Long Street crossing with wider structure for public space
High Street crossing today
High Street crossing
High Street crossing with wider structure for public space
Comment Period - until February 24 Start Discussion of Enhancement Details – Spring 2009 Finding of No Significant Impact – May 2009
!"
Total Project Cost is $1.69 Billion
$196 M $135 M $240 M $86 M $345 M $688 M
Major Investment Study (December 2005)
dollars)
Refinements due to engineering
Cost escalation due to inflation
$512 million Tier I TRAC Commitment The first two phases along the east side will have priority
# #
!"#$%& &' '& &'% '% ()$ ()$& &'%% '%%& &
$(*#!+,+""!-