Hypergeometric Probability Distributions MDM4U: Mathematics of Data - - PDF document

hypergeometric probability distributions
SMART_READER_LITE
LIVE PREVIEW

Hypergeometric Probability Distributions MDM4U: Mathematics of Data - - PDF document

p r o b a b i l i t y d i s t r i b u t i o n s p r o b a b i l i t y d i s t r i b u t i o n s Hypergeometric Probability Distributions MDM4U: Mathematics of Data Management Recap What is the probability of receiving two hearts in a three-card


slide-1
SLIDE 1

p r o b a b i l i t y d i s t r i b u t i o n s

MDM4U: Mathematics of Data Management

Successes Among Dependent Events

Hypergeometric Probability Distributions

  • J. Garvin

Slide 1/14

p r o b a b i l i t y d i s t r i b u t i o n s

Hypergeometric Probability Distributions

Recap

What is the probability of receiving two hearts in a three-card hand dealt from a standard deck? The sample space is the number of three-card hands, or 52C3. There are 13 hearts in a deck, and 39 cards in the remaining 3 suits. Therefore, a two-heart hand can be dealt in

13C2 × 39C1 ways.

The probability is P(2) = 13C2 × 39C1

52C3

= 3042 22100 ≈ 0.138.

  • J. Garvin — Successes Among Dependent Events

Slide 2/14

p r o b a b i l i t y d i s t r i b u t i o n s

Hypergeometric Probability Distributions

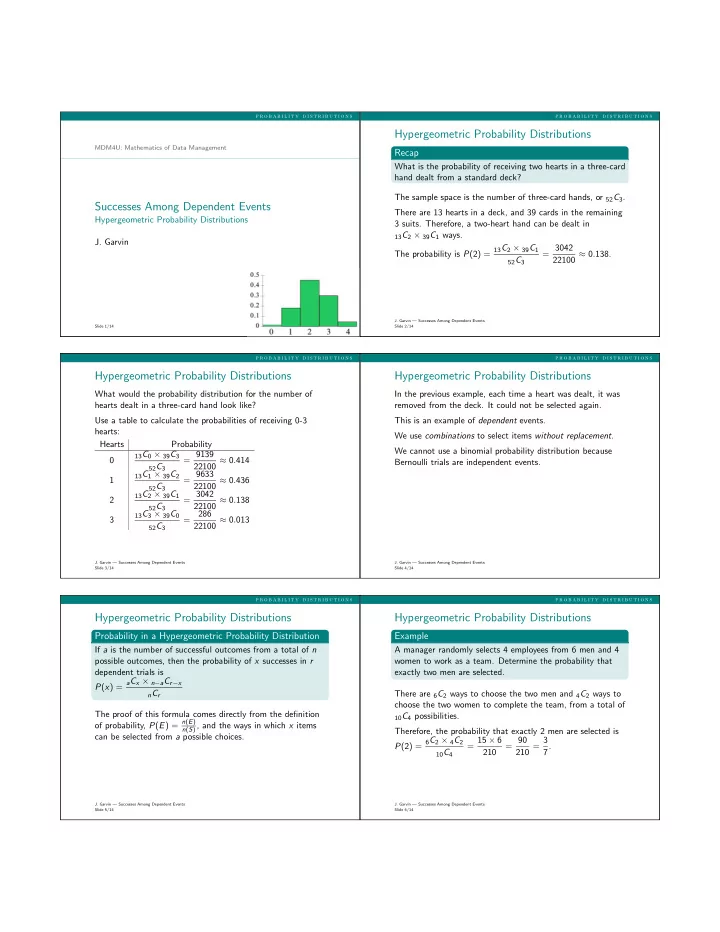
What would the probability distribution for the number of hearts dealt in a three-card hand look like? Use a table to calculate the probabilities of receiving 0-3 hearts: Hearts Probability

13C0 × 39C3 52C3

= 9139 22100 ≈ 0.414 1

13C1 × 39C2 52C3

= 9633 22100 ≈ 0.436 2

13C2 × 39C1 52C3

= 3042 22100 ≈ 0.138 3

13C3 × 39C0 52C3

= 286 22100 ≈ 0.013

  • J. Garvin — Successes Among Dependent Events

Slide 3/14

p r o b a b i l i t y d i s t r i b u t i o n s

Hypergeometric Probability Distributions

In the previous example, each time a heart was dealt, it was removed from the deck. It could not be selected again. This is an example of dependent events. We use combinations to select items without replacement. We cannot use a binomial probability distribution because Bernoulli trials are independent events.

  • J. Garvin — Successes Among Dependent Events

Slide 4/14

p r o b a b i l i t y d i s t r i b u t i o n s

Hypergeometric Probability Distributions

Probability in a Hypergeometric Probability Distribution

If a is the number of successful outcomes from a total of n possible outcomes, then the probability of x successes in r dependent trials is P(x) = aCx × n−aCr−x

nCr

The proof of this formula comes directly from the definition

  • f probability, P(E) = n(E)

n(S), and the ways in which x items

can be selected from a possible choices.

  • J. Garvin — Successes Among Dependent Events

Slide 5/14

p r o b a b i l i t y d i s t r i b u t i o n s

Hypergeometric Probability Distributions

Example

A manager randomly selects 4 employees from 6 men and 4 women to work as a team. Determine the probability that exactly two men are selected. There are 6C2 ways to choose the two men and 4C2 ways to choose the two women to complete the team, from a total of

10C4 possibilities.

Therefore, the probability that exactly 2 men are selected is P(2) = 6C2 × 4C2

10C4

= 15 × 6 210 = 90 210 = 3 7.

  • J. Garvin — Successes Among Dependent Events

Slide 6/14

slide-2
SLIDE 2

p r o b a b i l i t y d i s t r i b u t i o n s

Hypergeometric Probability Distributions

Your Turn

You shuffle a standard deck of cards, and deal a hand of five cards from atop the deck. What is the probability that the hand contains exactly three clubs? There are 13C3 ways to choose the clubs and 39C2 ways to choose the remaining two cards in the hand. There are a total of 52C5 possible five-card hands. Therefore, the probability of having exactly 3 clubs is P(3) = 13C3 × 39C2

52C5

= 2 717 33 320 ≈ 0.08.

  • J. Garvin — Successes Among Dependent Events

Slide 7/14

p r o b a b i l i t y d i s t r i b u t i o n s

Hypergeometric Probability Distributions

Example

A quality control inspector at a popsicle factory knows that approximately 6% of all popsicles shipped by the factory are

  • broken. He randomly pulls 10 popsicles from a batch of 500

for testing. What is the probability that at least 2 are broken? If 6% of all popsicles are broken, there should be 500 × 0.06 = 30 broken popsicles in the batch. This means there are 30 broken (a) and 470 (n − a) non-broken popsicles, from which 10 (x) must be selected from a total of 500 (n) popsicles.

  • J. Garvin — Successes Among Dependent Events

Slide 8/14

p r o b a b i l i t y d i s t r i b u t i o n s

Hypergeometric Probability Distributions

To find the probability that at least 2 are broken, use an indirect method, eliminating the cases where no popsicles or

  • ne popsicle is broken.

P(x ≥ 2) = 1 − P(0) − P(1) = 1 − 30C0 × 470C10

500C10

− 30C1 × 470C9

500C10

≈ 0.116

  • J. Garvin — Successes Among Dependent Events

Slide 9/14

p r o b a b i l i t y d i s t r i b u t i o n s

Expected Value

Like the previous probability distributions, there is a formula for expected value.

Example

In a hypergeometric probability distribution consisting of r trials, with a successful outcomes from a total of n possible

  • utcomes, the expected value is

E(X) = ra n Since the proof of this formula requires a great deal of algebraic manipulation, it is left as an exercise for the determined student.

  • J. Garvin — Successes Among Dependent Events

Slide 10/14

p r o b a b i l i t y d i s t r i b u t i o n s

Expected Value

Example

A bag contains 15 red and 20 blue marbles. If 7 marbles are randomly drawn from the bag, what is the expected number

  • f red marbles drawn?

There are r = 7 dependent trials, and a = 15 successful

  • utcomes from a total of n = 15 + 20 = 35 possible
  • utcomes.

So the expected number of red marbles drawn is E(X) = 7 × 15 35 = 105 35 = 3.

  • J. Garvin — Successes Among Dependent Events

Slide 11/14

p r o b a b i l i t y d i s t r i b u t i o n s

Expected Value

Your Turn

1000 fish from a small lake were caught and tagged. After

  • ne year, a new catch of 500 fish contained 60 that were
  • tagged. What is the estimated fish population in the lake?

Hint: What do the three values given above represent in the equation for expected value? There are r = 500 trials (the new catch). There are a = 1000 successful outcomes (catching a tagged fish). The expected value is E(X) = 60 (the number of tagged fish caught). Substituting into the expected value equation, we obtain 60 = 500 × 1000 n , or n = 500 × 1000 60 ≈ 8333 fish.

  • J. Garvin — Successes Among Dependent Events

Slide 12/14

slide-3
SLIDE 3

p r o b a b i l i t y d i s t r i b u t i o n s

Expected Value

A alternative method of solving is to assume that the proportion of tagged fish in the sample corresponds to that

  • f the entire population.

60 tagged fish were caught in a sample of 500, for a proportion 60 500. 1000 fish from the entire population were originally tagged, for a proportion 1000 n . Therefore, 60 500 = 1000 n . This can be rearranged as n = 500 × 1000 60 ≈ 8333 fish, as obtained earlier.

  • J. Garvin — Successes Among Dependent Events

Slide 13/14

p r o b a b i l i t y d i s t r i b u t i o n s

Questions?

  • J. Garvin — Successes Among Dependent Events

Slide 14/14