
SLIDE 1
1
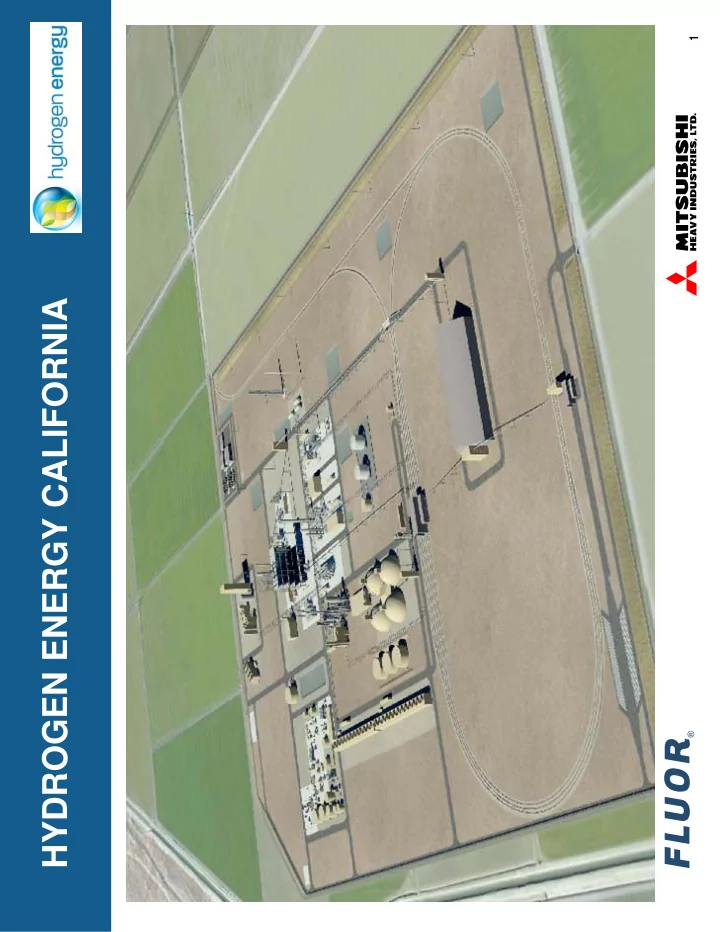
HYDROGEN ENERGY CALIFORNIA
1
HYDROGEN ENERGY CALIFORNIA Hydrogen Energy California Update - - PDF document
1 1 HYDROGEN ENERGY CALIFORNIA Hydrogen Energy California Update GASIFICATION TECHNOLOGIES CONFERENCE October 14, 2013 Project and Permitting Update Design Development During FEED Carbon Dioxide Emissions Efficiency Jim
1
1
2
3
4
5
– http://www.gasification.org/uploads/downloads/Conferences/2012/presentations/GTC-2012-7-3.pdf
6
7
All PSA Off-Gas was previously burned in the HRSG duct burner The permit application used typical duct burner emissions rates Duct burner suppliers did not offer emissions guarantees consistent with the
Process configuration was modified
Duct Burners Now Burn Only Blended Fuel and Only During On-Peak PSA #2 Off-Gas now compressed to ~500 psig; previously 50 psig Net Efficiency Loss for On-Peak Operation Net Efficiency Gain for Off-Peak Operation
8
Please see the link below for more details of the Carbon Dioxide Emissions Performance
Standard Calculations and Efficiency Calculations
http://docketpublic.energy.ca.gov/PublicDocuments/08-AFC-08A/TN200144_20130809T143916_Responses_to_PSADEIS_Information_Requests_Set_1.pdf
California SB 1368 Compliance
– Standard is less than 1,100 pounds CO2 per MW-h – Standard applies to utilities purchasing power under contracts with durations longer than 5 years
HECA Emissions:
– Steady-State Operations
153 pounds CO2 per MW-h
Excludes venting of EOR CO2 and missions during start-ups and shut-downs
– Mature Operations
227 pounds CO2 per MW-h
Includes Maximum Permitted Venting of EOR CO2
Includes emissions during start-ups and shut-downs
– Early Operations
301 pounds CO2 per MW-h
Includes Maximum Permitted Venting of EOR CO2
Includes emissions during start-ups and shut-downs (more frequent during early operations)
– Emissions values account for carbon dioxide emissions attributable to power generation, not fertilizer production
Low carbon dioxide emissions are achieved by removal of 90% of the carbon compounds
from the syngas
9
AGR Power Block (CT / ST / HRSG) Gasification Sulfur Recovery Unit CO2 Compression (EOR) Urea / UAN
Coal Coke Gasification Solids Feedstock Dryer Exhaust to Atmosphere CO2 for EOR CTG Exhaust to Atmosphere Liquid Sulfur Acid Gas Clean Syngas
Off-Sites, Utilities, and Water Treatment CO2 Compression/ Purification Sour Shift & LTGC PSA & Ammonia
Urea UAN Flux CO2 CTG Exhaust to Feedstock Dryer Combustion Air to CT Tail Gas PSA Off-Gas
Coal and Coke 4,750 MMBTU/h HHV 4,480 MMBTU/h LHV Total Clean Syngas 3,910 MMBTU/h HHV 3,320 MMBTU/h LHV PSA Off-Gas 154 MMBTU/h HHV On-Peak 257 MMBTU/h HHV Off-Peak 137 MMBTU/h LHV On-Peak 229 MMBTU/h LHV Off-Peak Total Fuel to Power Block 2,774 MMBTU/h HHV On-Peak 2,027 MMBTU/h HHV Off-Peak 2,367 MMBTU/h LHV On-Peak 1,729 MMBTU/h LHV Off-Peak Clean Syngas Cold Gas Efficiency 82.3% HHV 74.1% LHV Power Block 416.0 MW Gross On-Peak 6,668 BTU/kW-h HHV On-Peak 315.2 MW Gross Off-Peak 6,430 BTU/kW-h HHV Off-Peak Power Block 338.7 MW Net On-Peak 8,190 BTU/kW-h HHV On-Peak 246.6 MW Net Off-Peak 8,218 BTU/kW-h HHV Off-Peak 65°F Ambient Temperature Gross Basis: Generator Output Net Basis: Generator Output minus Power Allocation of Auxiliary Loads per SB1368 calculations (Page CS-7-1-2) Power Block 416.0 MW Gross On-Peak 5,691 BTU/kW-h LHV On-Peak 315.2 MW Gross Off-Peak 5,485 BTU/kW-h LHV Off-Peak Power Block 338.7 MW Net On-Peak 6,989 BTU/kW-h LHV On-Peak 246.6 MW Net Off-Peak 7,011 BTU/kW-h LHV Off-Peak 10
Hydrogen Energy California (08-AFC-8A) Responses to PSA/DEIS Information Requests Carbon Sequestration and Greenhouse Gas Emissions
CS-7C – 2
R:\13 HECA\PSA_DEIS\IR\Resp IR Set 1.docx
Table CS-7-1 Representative Heat and Material Balances
Parameter Units Hydrogen-Rich Fuel Maximum Power Production Maximum Ammonia Production Maximum Power Production Maximum Ammonia Production Maximum Power Production Maximum Ammonia Production Daily Average On-Peak Off-Peak On-Peak Off-Peak On-Peak Off-Peak Ambient Temperature °Fahrenheit 97 97 39 39 65 65 65 Gross Power Generation (CT/ST) MW 421.8 320.9 409.1 309.2 416.0 315.2 382.4 Power Generation Fertilizer Contribution MW 3.5 11.3 3.5 11.3 3.5 11.3 6.1 Power Generation Less Fertilizer Contribution MW 418.3 309.6 405.6 297.9 412.5 303.9 376.3 Total Auxiliary Load MW 150.5 164.1 150.5 164.1 150.5 164.1 155.0 Gasification MW 12.1 12.1 12.1 12.1 12.1 12.1 12.1 Shift and LTGC MW 0.9 0.9 0.9 0.9 0.9 0.9 0.9 AGR MW 19.3 19.3 19.3 19.3 19.3 19.3 19.3 SRU MW 2.0 2.0 2.0 2.0 2.0 2.0 2.0 EOR CO2 Compression MW 36.1 36.1 36.1 36.1 36.1 36.1 36.1 PSA and Ammonia Units MW 33.3 46.8 33.3 46.8 33.3 46.8 37.8 CO2 Purification MW 6.1 6.1 6.1 6.1 6.1 6.1 6.1 Urea/UAN MW 6.0 6.0 6.0 6.0 6.0 6.0 6.0 Power Block MW 5.7 5.4 5.7 5.4 5.7 5.4 5.6 Water Treatment MW 6.4 6.4 6.4 6.4 6.4 6.4 6.4 Power Cooling Tower MW 4.0 4.0 4.0 4.0 4.0 4.0 4.0 Process Cooling Tower MW 9.7 9.7 9.7 9.7 9.7 9.7 9.7 Fertilizer Storage/Handling MW 0.6 0.6 0.6 0.6 0.6 0.6 0.6 Other Supporting Systems MW 8.3 8.7 8.3 8.7 8.3 8.7 8.4 Net Power Export MW 271 157 259 145 266 151 227
Notes: AGR = acid gas removal PSA = Pressure Swing Adsorption CO2 = carbon dioxide SRU = sulfur recovery unit CT = combustion turbine ST = steam turbine EOR = enhanced oil recovery UAN = urea ammonium nitrate LTGC = low-temperature gas cooling
http://docketpublic.energy.ca.gov/PublicDocuments/08-AFC-08A/TN200144_20130809T143916_Responses_to_PSADEIS_Information_Requests_Set_1.pdf
DOCUMENT SOURCE: 11
12
13
On a daily average basis, 64.9% of the syngas energy is used to
MAXIMUM POWER PRODUCTION (16 Hours/Day)
MAXIMUM AMMONIA PRODUCTION (8 Hours/Day)
14