
SLIDE 1
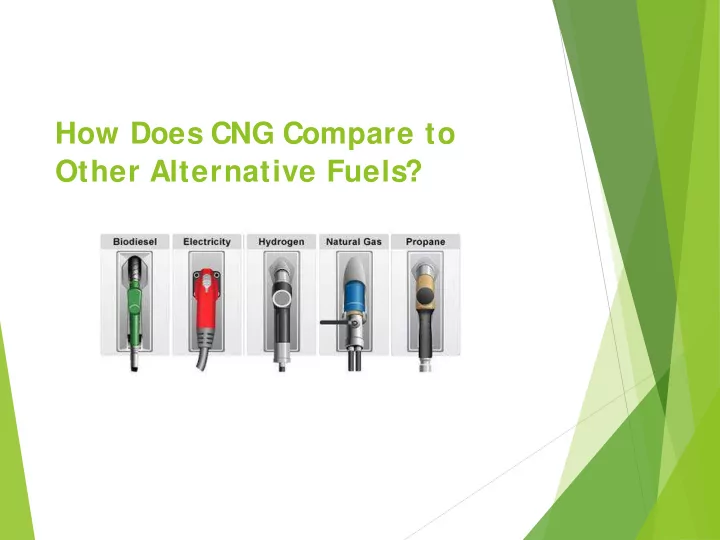
How Does CNG Compare to Other Alternative Fuels?
How Does CNG Compare to Other Alternative Fuels? About Kwik Trip: - - PowerPoint PPT Presentation
How Does CNG Compare to Other Alternative Fuels? About Kwik Trip: Founded in 1965, Kwik Trip, Inc. is one of the largest independently held convenience store chains in the United States. Dedicated to service and making a difference in the
How Does CNG Compare to Other Alternative Fuels?
About Kwik Trip:
Founded in 1965, Kwik Trip, Inc. is one of the largest independently held convenience store chains in the United States. Dedicated to service and making a difference in the lives
stores in Wisconsin, Minnesota and Iowa and employs
With an emphasis on vertical integration, the company also operates its own kitchens, bakery, and dairy and maintains its own distribution center and fleet under the Convenience Transportation name. Kwik Trip has been recognized as a Top Workplace in Wisconsin by the Milwaukee Journal Sentinel for each of the last eight years and was recently awarded the No. 1 ranking for 2018. Today, Kwik Trip continues to grow through new initiatives like a strong focus on food and value-priced commodities.
644 Stores 396 in Wisconsin 162 in Minnesota 85 in Iowa 518 sell diesel 190 side diesel (separate diesel lanes) 123 stores have in line DEF dispensers 35 CNG (1 LNG)
Transportation Arm of Kwik Trip Delivery of Food and Petroleum Products to our stores
Travel approximately 28 million miles Continue to run and maintain diesel powered 80%
Natural gas powered
Vehicle –Available/ in production & application Fuel Price Fuel Price volatility Fuel Availability S
trategic Fit – sustainability, mission
Operational Fit Up Front Cost Maintenance Resale
Considerations
The Information Source for Alternative Fuels and Advanced Vehicles The Alternative Fuels Data Center (AFDC) provides information, data, and tools to help fleets and other transportation decision makers find ways to reach their energy and economic goals through the use of alternative and renewable fuels, advanced vehicles, and other fuel-saving measures.
CNG/ RNG (Compressed Natural Gas) LNG (Liquefied Natural Gas) Propane Coast Development
Hydrogen Elect ric
Payback Modeling
$3.750 85% $1.790 RETAIL 7 Current Price of CNG (DGE) $1.990 Maintenance Cost per Mile (Diesel) $0.060 Per Mile $0.060 (12L seeing cost neutral) $534 $0.006 2.0% 0.5% 85,000 Total CNG-DGE Gallons (During Demo) $110,000 GGE to DGE 1.112 $40,000 $110,000 $150,000 Demo Result (unhide 30 thru 39) Diesel 2.0% 4.0% 6.0% 8.0% 10.0% 12.0% 18.0% Years 1 2 3 4 5 6 7… 10 Vehicle Life Miles 85,000 170,000 255,000 340,000 425,000 510,000 595,000 850,000 Diesel Vehicle Initial Cost of vehicle (110,000) $ Annual Fuel cost (Diesel) (45,536) $ (46,446) $ (47,357) $ (48,268) $ (49,179) $ (50,089) $ (51,000) $ (53,732) $ Maintenance Cost (5,100) $ (5,100) $ (5,100) $ (5,100) $ (5,100) $ (5,100) $ (5,100) $ (5,100) $ Residual Diesel Value Miscellaneous Cost (DEF) (534) $ (534) $ (534) $ (534) $ (534) $ (534) $ (534) $ (534) $ Total Cumulative cost (161,170) $ (213,251) $ (266,242) $ (320,144) $ (374,957) $ (430,681) $ (487,315) $ (662,682) $ Cost per Mile (1.90) (0.61) (0.62) (0.63) (0.64) (0.66) (0.67) (0.70) CNG 0.5% 1.0% 1.5% 2.0% 2.5% 3.0% 4.5% 1 2 3 4 5 6 9 Years 1 2 3 4 5 6 7… 10 Vehicle Life Miles 85,000 170,000 255,000 340,000 425,000 510,000 595,000 850,000 CNG Vehicle Initial Cost of vehicle (150,000) $ Annual Fuel cost (CNG) (28,435) $ (28,578) $ (28,720) $ (28,862) $ (29,004) $ (29,146) $ (29,288) $ (29,715) $ Maintenance Cost (5,100) $ (5,100) $ (5,100) $ (5,100) $ (5,100) $ (5,100) $ (5,100) $ (5,100) $ Residual CNG Value Miscellaneous CostPayback of CNG Vehicle*: 2.21
Years188,071
MilesNet Present Value of choosing CNG (NPV): $114,807
WACC:6%
*Based on average efficiency performance that Kwik Trip observes *Payback Period, Mileage to Payback, and NPV do not include Residual value of Asset **2000 pounds weight exemption payback is not included Current Price of CNG (GGE) MPG DieselCompressed Natural Gas (CNG) Calculator - DEF, Maintenance, Upcharge
Data Inputs
General Current Price of Diesel Fuel efficiency of CNG (DGE) Vs. Diesel Maintenance Cost per Mile (CNG) Annual Misc Cost-Diesel (if needed) DEF Annual Miscellaneous Cost-CNG (if needed) Demo Data Inputs Payback Data Inputs Total Miles (During Demo)
― Vehicle –Available/ in production & application Fuel Price Fuel Price volatility Fuel Availability S
trategic Fit – sustainability, mission
Operational Fit
— Up Front Cost
― Maintenance ― Resale
Considerations – still work to do!
Joel Fasnacht j fasnacht@ kwiktrip.com 608-793-6400