Who D o Do o We e Have i in th the R Room? Council of Policy - - PowerPoint PPT Presentation

who d o do o we e have i in th the r room
SMART_READER_LITE
LIVE PREVIEW

Who D o Do o We e Have i in th the R Room? Council of Policy - - PowerPoint PPT Presentation

Who D o Do o We e Have i in th the R Room? Council of Policy Maker Other National Lab Other Governments 4% Government 4% State DOT Non-profit 3% 1% Agency 13% 8% 3% FHWA Division Office Utility 10% 4% Clean Cities 13%


slide-1
SLIDE 1

Who D

  • Do
  • We

e Have i in th the R Room?

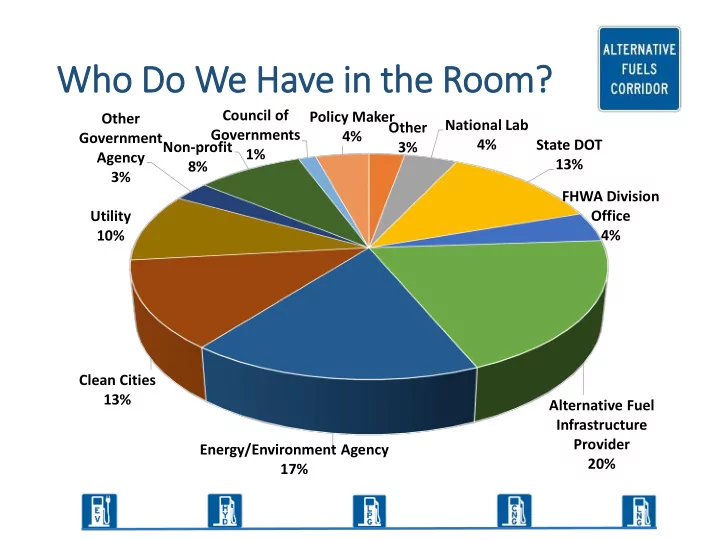
Other 3% National Lab 4% State DOT 13% FHWA Division Office 4% Alternative Fuel Infrastructure Provider 20% Energy/Environment Agency 17% Clean Cities 13% Utility 10% Other Government Agency 3% Non-profit 8% Council of Governments 1% Policy Maker 4%

slide-2
SLIDE 2

Which ch a alternativ ive f fuel a l are y e you

  • u

most i inte tereste ted i in advan ancing/deployi ying?

Electricity 44% Natural Gas (CNG, LNG) 19% Propane (LPG) 14% Hydrogen 23%

slide-3
SLIDE 3

What t do

  • you
  • u th

think a are th the t e top

  • p

barrie iers t to cr crea eatin ing s succe ccessfu ful l alter ernati tive f e fuel el c corridor

  • rs?

5 10 15 20 25 30 35 40

Siting/NEPA process/Permitting Visibility from roadway Codes/Standards Poor coordination among states Lack of corridor specific planning tools/resources for siting… Fuel supply Low cost of conventional fuels Vehicle availability Lack of awareness of alternative fuel benefits Consumer adoption of vehicles Station economics Supply <-> Market demand for alternative fuels Lack of incentives/Financing

slide-4
SLIDE 4

Which s stakeh ehold

  • lder

er(s) a are y e you mos

  • st l

look

  • kin

ing for

  • rward t

to

  • connecting w

with? h?

5 10 15 20 25 30 35 40 45

MPOs/COGs/TPOs/Planning Agencies Clean Cities Coalitions Vehicle manufacturers/OEMs Fleet representatives FHWA Division Office staff Alternative Fuel Infrastructure Providers Utility representatives State Energy/Environment Agency staff State DOTs