
SLIDE 1
10/17/2019 1
Home Deliveries: Not just for pizza?
Robyn Lamar, MD, MPH Assistant Professor OB GYN, UCSF October 2019
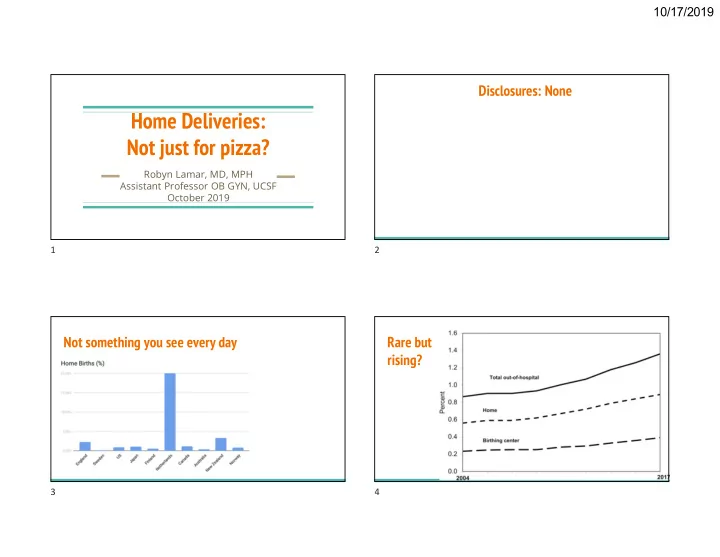
Disclosures: None Not something you see every day Rare but rising?
1 2 3 4
Home Deliveries: Not just for pizza? Robyn Lamar, MD, MPH - - PowerPoint PPT Presentation
10/17/2019 Disclosures: None Home Deliveries: Not just for pizza? Robyn Lamar, MD, MPH Assistant Professor OB GYN, UCSF October 2019 1 2 Not something you see every day Rare but rising? 3 4 1 10/17/2019 LIstening to Mothers in
Robyn Lamar, MD, MPH Assistant Professor OB GYN, UCSF October 2019
1 2 3 4
LIstening to Mothers in California, 2017 survey
Why do some women choose home birth? How do they fare? How do their children fare? What factors are critical for safe maternity care?
hemorrhage, oxygen tank, IV supplies, etc
and CPR training to attend the birth
5 6 7 8
9 10 11 12
[hint: not about glamor]
#1: Previous negative experiences with hospital care
process, and the experience of interventions of questionable utility
multiple strangers
#2: Control & Empowerment
decisions for myself”
things that are done to my body” 13 14 15 16
#3: Benefits of the home environment
dynamic
The literature is sparse In the small studies that have looked at this:
intrapartum transfer of care, when compared to women planning hospital birth who require escalation
○ Selection bias ○ Misclassification (especially planned versus unplanned home births) ○ Choosing the best comparison group ○ Identifying & controlling for all relevant confounders
○ Training & experience of home birth providers ○ Established criteria for home birth ○ Integration of health system ○ Transport/physical distances
17 18 19 20
OR 0.35 (0.27-0.46)
OR 0.37 (0.24-0.58)
OR 0.57 (0.40-0.81)
OR 0.55 (0.55-0.96)
Name, year Country Study Design N home N hospital Quality Birthplace in England 2011 UK Prospective cohort 16,810 19,706 High Blix 2012 Norway Retrospective cohort 1,631 16,310 High Bolten 2016 Netherlands Prospective cohort 2,050 1,445 High Davis 2011 New Zealand Comparative descriptive 1,830 11,503 High Haldansdottir 2015 Iceland Retrospective matched cohort 307 921 High Hiraizumi 2013 Japan Retrospective cohort 168 340 Moderate Homer 2014 Australia Retrospective population- based cohort 742 242,936 High Miller 2012 New Zealand Retrospective matched cohort 109 116 Moderate Wiegerinck 2015 Netherlands Retrospective cohort 23,323 29,306 Moderate
21 22 23 24
○ “Healthy women with low risk pregnancies,” defined before labor ○ Attended by an NHS midwife at onset of labor ○ 37 weeks, singleton, live at onset of labor
care at home + a stratified random sample of obstetric units, 2008-2010
○ Primary: composite of perinatal mortality + specific morbidities ○ Secondary: maternal morbidities, interventions, and mode of birth ○ Planned subgroup analysis by parity
aOR (99% CI) Op Vag 0.43 (0.32-0.57) C/s 0.31 (0.23-0.41) Epis 0.33 (0.28-0.39) 3rd/4th 0.77 (0.57-1.05) Transfusion 0.72 (0.47-1.12)
births that occurred in Oregon during 2012 and 2013
○ Perinatal mortality and morbidity (low apgars, seizure, ventilator support, NICU admit) ○ Maternal morbidity, interventions, and mode of birth
25 26 27 28
aOR (95% CI) Op Vag 0.24 (0.17-0.34) C/s 0.18 (0.16-0.22) ICU Admit 1.00 (0.31-3.21) 3rd/4th 0.69 (0.49-0.98) Transfusion 1.91 (1.25-2.93)
Findings are split depending on the study type:
Most show no differences in stillbirth, early neonatal death, or NICU admission
Higher risk of stillbirth, early neonatal death, seizures, and NICU admission
○ Fractured health care system ○ Birth certificates didn’t indicate planned place of birth
new birth certificate data show: ○ Higher perinatal mortality ○ Higher neonatal morbidity 29 30 31 32
aOR (99% CI) Perinatal death 2.43 (1.37 to 4.30) Apgar <4 at 5 minutes 1.75 (1.07-2.86) NICU admit in first week 0.71 (0.55 to 0.92) Neonatal seizure 3.60 (1.36 to 9.50)
2013 in states that used the 2003 revised birth certificate
○ Parity ○ Maternal age ○ Gestational age ○ Presentation ○ Prior cesarean
Findings are largely consistent across studies in multiple countries and a variety of study designs: babies fare well
OR 0.94(0.76-1.17)
OR 1.00 (0.78-1.27)
OR 0.71 (0.55-0.92) 33 34 35 36
Name, year Country Study Design N home N hospital Quality Birthplace in England 2011 UK Prospective cohort 16,810 19,706 High Blix 2012 Norway Retrospective cohort 1,631 16,310 High Burns 2012 UK Prospective cohort 2,964 4,130 High Davis 2011 New Zealand Comparative descriptive 1,830 11,503 High De Jonge 2015 Netherlands Retrospective cohort 466,122 276,958 High Haldansdottir 2015 Iceland Retrospective matched cohort 307 921 High Homer 2014 Australia Retrospective population- based cohort 742 242,936 High
aOR (99% CI) Nullip Multip Perinatal death 0.99 (0.79– 1.24) 1.16 (0.87– 1.55) Apgar <4 at 5 minutes 0.87 (0.71– 1.07) 0.92 (0.70– 1.20) NICU admit in first week 1.04 (0.91– 1.18) 0.74 (0.62– 0.87) Serious adverse
0.93 (0.84– 1.04) 0.76 (0.66– 0.87)
aOR (99% CI) All 1.16 (0.76-1.77) Nullips 1.75 (1.07-2.86) Multips 0.72 (0.41-1.27) Composite outcome includes: Stillbirth, early neonatal death, HIE, mec aspiration syndrome, brachial plexus injury, fractured humerus or clavicle
○ Prenatal care booked with registered midwife in Ontario ○ No more than 1 prior cesarean
at start of labor, matched for parity and prior c/s to low risk group planning hospital birth 2006-2009 (N = 11, 493 in each group)
○ Primary: composite of perinatal death, 5 min Apgar < 4; chest compression; PPV ○ Secondary: intrapartum intervention, mode of delivery, maternal morbidity
37 38 39 40
RR (95% CI) Nullip Multip Perinatal death 1.17 (0.39– 3.47) 0.67 (0.11– 3.99) Apgar <4 at 5 minutes 0.67 (0.36– 1.26) 0.75 (0.36– 1.59) PPV & cardiac compressions 1.11 (0.59– 2.10) 0.89 (0.34– 2.30)
Norway, New Zealand) show excellent neonatal
data show higher risk of perinatal mortality for planned home birth (OR ~2-3)
Planned home birth is not inherently unsafe for babies. However, as it currently exists in the US, it appears riskier than planned hospital birth
Common themes in countries with good neonatal outcomes in planned home birth:
candidates
pts
○ Birthplace in England: nullips ~40%, multips ~10%
41 42 43 44
“Although the American College of Obstetricians and Gynecologists believes that hospitals and accredited birth centers are the safest settings for birth, each woman has the right to make a medically informed decision about delivery.” Key safety factors to highlight in counseling:
Confederation of Midwives’ Global Standards for Midwifery Education
prior cesarean delivery
1.1.1 Explain to both multiparous and nulliparous women who are at low risk of complications that giving birth is generally very safe for both the woman and her baby. 1.1.2 Explain to both multiparous and nulliparous women that they may choose any birth setting (home, freestanding midwifery unit, alongside midwifery unit or obstetric unit), and support them in their choice of setting wherever they choose to give birth: . . . Advise low-risk nulliparous women that planning to give birth in a midwifery-led unit (freestanding or alongside) is particularly suitable for them . . . Explain that if they plan birth at home there is a small increase in the risk of an adverse outcome for the baby. [2014]
45 46 47 48
neonates, even when it harms their mothers
entirely
○ TOLAC ○ Breech ○ Multiples ○ Postterm
collective imagination about what high quality maternity care looks like.
*Don’t panic* Evidence shows
inevitability, and the absolute risk difference is small Home birth is safe in other parts of the world, and it could be here, too
THANK YOU!
Midwifery Womens Health. 2016 Jan-Feb;61(1):127-33.
low risk pregnancies: the Birthplace in England national prospective cohort study. BMJ. 2011 Nov 23;343:d7400.
Womens Health. 2009 Mar-Apr;54(2):119-26.
Midwifery Womens Health. 2006 Mar-Apr;51(2):91-7.
women in the Netherlands: the association with planned place of birth and transfer of care during labour. BMC Pregnancy
Apr;216(4):401.e1-401.e8.
income countries: A systematic review and meta-analysis. Midwifery. 2018 Jul;62:240-255.
birth place. PLoS One. 2017 Aug 10;12(8):e0182991. doi: 10.1371/journal.pone.0182991
Published 2015 Apr 8. doi:10.2147/IJWH.S55561
49 50 51 52