has the spending slowdown ended what path are we on
play

Has the spending slowdown ended? What path are we on? Is it - PowerPoint PPT Presentation

Has the spending slowdown ended? What path are we on? Is it sustainable? New Dimensions on Sustainable U.S. Health Spending July 21, 2015 Charles Roehrig Altarum Institute integrates independent research and client-centered consulting to


  1. Has the spending slowdown ended? What path are we on? Is it sustainable? New Dimensions on Sustainable U.S. Health Spending July 21, 2015 Charles Roehrig Altarum Institute integrates independent research and client-centered consulting to deliver comprehensive, systems-based solutions that improve health and health care. A nonprofit, Altarum serves clients in both the public and private sectors. For more information, visit www.altarum.org

  2. Has the 2009-2013 Slowdown Ended? Growth in Health Spending and GDP Source: July 2015 HSEI spending brief . Note depth of recent recession, historically low health spending growth from 2009 – 2013, and 2014-15 acceleration. 2

  3. Underlying Health Spending Path: 1980-2007 From 1980 to 2007, spanning three recessions, the marginal propensity to spend on health was about 25%. 3

  4. Implications for Excess Growth: 1981-2007 Underlying Growth Above GDP: 1981-2007 4.5% 4.0% 4.0% 3.5% 3.0% 2.4% 2.5% 2.0% 1.6% 1.3% 1.5% 1.0% 0.5% 0.0% 1981 1983 1985 1987 1989 1991 1993 1995 1997 1999 2001 2003 2005 2007 Holding the marginal propensity to spend at 25% results in a downward sloping excess growth curve, falling from 4% in 1981 to 1.3% in 2007. 4

  5. The Post-Recession Slowdown: 2009-2013 3.5% Economywide Inflation 3.0% 2.6% Structures, Pub Health, 2.5% Dental 2.0% 1.6% Prescription Drugs 1.5% Other NHE 1.0% 0.4% Health Care Services: 0.3% 0.5% Medicare* 0.2% 0.2% Health Care Services: 0.0% -0.1% Other Payers* * excludes dental -0.5% Health spending growth slowed from 6.5% pre-recession (2005-2007) to 3.9% post-recession (2009-2013) – a decline of 2.6 percentage points. Lower economy-wide inflation explains most of this decline. 5

  6. Underlying Health Spending Path: Post-2007 Despite the slowdown, the severity of the recession has moved us well above the 1980-2007 path. Starting in 2013, we need 10 years of GDP+0 growth to get back to this path! This is highly unlikely, particularly since we will almost certainly experience another recession during this time period. 6

  7. Health Spending in 2014 and 2015 to Date  2014  Health spending up 5.0% (Altarum estimate)  GDP up 3.9% • Health spending at GDP + 1.1  1Q 2015  Health spending up 7.5% (y-o-y using QSS)  GDP up 3.7% • Health spending at GDP + 3.8!  We think that health spending will fall back below 6% growth in the final quarters of 2015 and, if economy-wide inflation remains low, should retreat below 5% as we enter 2016. 7

  8. Our Long Term Path  CBO projects that we will finally get back to full employment in 2017. By that time, most of the effects of expanded coverage will have been realized. What path will health spending follow from 2017 forward?  Suppose we return to spending 25% of the growth in real per capita income on health from 2017 forward  CBO projects that real per capita income will grow at about 1.2% per year, much slower than the 2% growth experienced between 1980 and 2007  This will put us on a path of GDP + 0.5, falling to GDP + 0.4 by 2035  It will require the per beneficiary cost trends for Medicare, Medicaid, and commercial insurers to be about GDP+0 due to the aging of the population! 8

  9. Is GDP + 0.5 a Sustainable Path for NHE for 2017-2035? 
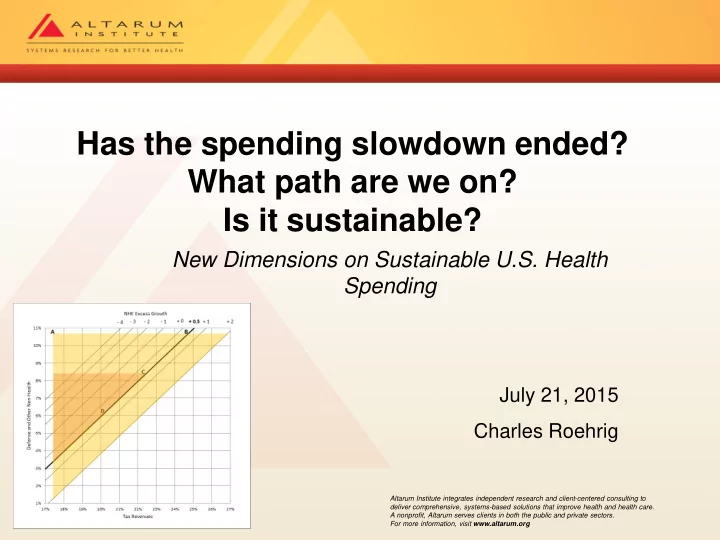
Triangle of Painful Choices The triangle explores the rate of excess growth in national health spending (starting in 2017) that would be consistent with a balanced budget in 2035, assuming social security to be at 6.3% of GDP (and 0.5% is set aside for interest payments). At point A, federal tax revenues and spending on defense and other non-health (DONH) items (excluding social security and interest) are at their historical average shares of GDP. A balanced budget at point A requires NO health spending! Point B shows that if we raise tax revenues close to 25%, we can retain our historical average spending on DONH and have a balanced budget at GDP+0.5. Point C shows DONH at 8.3% of GDP, its current value and close to the minimum over the past 50 years. GDP+0.5 requires tax revenues at 22.3% of GDP. CBO’s extended baseline sets DONH at 6% (point D).** ** My DONH is 1% lower than CBO as I shift roughly this amount into health. 9

  10. Clinical vs. Non-Clinical Determinants of Health Most of the ONH spending is on social programs that impact non-clinical determinants of health. Thus the triangle illustrates the tradeoff between controlling the rate of increase in (mostly) clinical care (NHE), and having resources available to invest in non-clinical determinants of health. 10

Download Presentation
Download Policy: The content available on the website is offered to you 'AS IS' for your personal information and use only. It cannot be commercialized, licensed, or distributed on other websites without prior consent from the author. To download a presentation, simply click this link. If you encounter any difficulties during the download process, it's possible that the publisher has removed the file from their server.

Recommend


More recommend