overview of hhr spending
play

Overview of HHR Spending During the 2008-10 biennium, $9.2 billion - PDF document

Overview of HHR Spending During the 2008-10 biennium, $9.2 billion in state spending is budgeted for Health and Human Resources (HHR) programs. HHR accounts for 26 percent of the Commonwealths state spending. Four state


  1. Overview of HHR Spending • During the 2008-10 biennium, $9.2 billion in state spending is budgeted for Health and Human Resources (HHR) programs. − HHR accounts for 26 percent of the Commonwealth’s state spending. • 
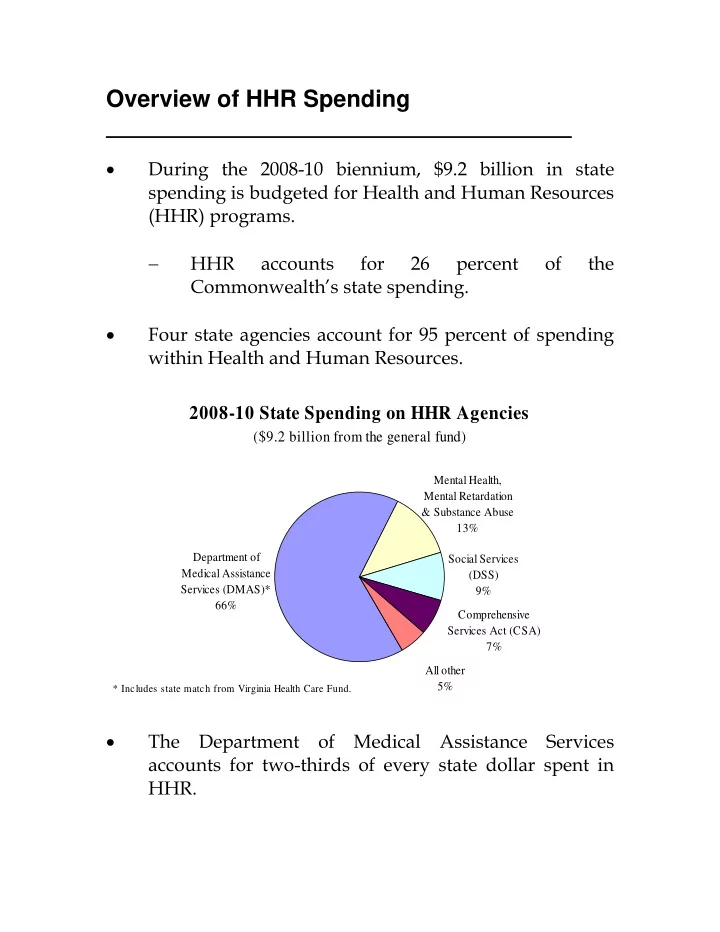
Four state agencies account for 95 percent of spending within Health and Human Resources. 2008-10 State Spending on HHR Agencies ($9.2 billion from the general fund) Mental Health, Mental Retardation & Substance Abuse 13% Department of Social Services Medical Assistance (DSS) Services (DMAS)* 9% 66% Comprehensive Services Act (CSA) 7% All other 5% * Includes state match from Virginia Health Care Fund. • The Department of Medical Assistance Services accounts for two-thirds of every state dollar spent in HHR.

  2. Medicaid Funding for Mental Health and Mental Retardation Services is Significant 2008-10 State Spending on HHR Agencies ($9.2 billion from the general fund) DMAS-funded Mental Health, MHMR Services Mental Retardation 8% & Substance Abuse 13% Social Services Department of (DSS) Medical Assistance 9% Services (DMAS)* 58% Comprehensive Services Act (CSA) 7% All other 5% * Includes state match from Virginia Health Care Fund. • Payments made on behalf of individuals with mental illness and mental retardation make up a significant share of DMAS’ spending. • Medicaid-funded mental health and mental retardation (MHMR) services account for eight percent of HHR spending. − MHMR services are among the fastest growing expenditures within Medicaid. S E F I C O 2 S F C E EN NA AT TE E IN NA AN NC CE E OM MM MI IT TT TE EE

  3. Four Agencies Account for Growth in HHR • Four agencies explain virtually all (96.8 percent) of the growth in state spending in HHR since FY 1998. HHR Agencies Contributing to Growth since FY 1998 Increase in state spending equals $2.8 billion. MHMRSAS 10.9% CSA DMAS* 8.1% 70.7% DSS 7.0% All other 3.2% * Includes state match from Virginia Health Care Fund. • Medicaid explains 71 percent of spending growth within HHR during this period. • While spending at DMAS has increased 8.5 percent each year since FY 1998, it is not the fastest growing program. S E F I C O 3 S F C E EN NA AT TE E IN NA AN NC CE E OM MM MI IT TT TE EE

  4. CSA is the Fastest Growing Program in HHR • General fund spending on the Comprehensive Services Act for At-Risk Youth and Families (CSA) increased from $101 million in FY 1998 to $324 million in FY 2010. Comparison of HHR Agency Growth Rates 12.0% 10.2% 10.0% Average Annual Growth 8.5% 8.0% 6.0% 4.0% 2.0% 0.0% S d I A * R S g h R H V S t r S S n R H M l a O B A i a C D g D o H H e D H M A B S M H D & f a e D * Includes state match from the Virginia Health Care Fund. • Per capita spending in CSA has nearly doubled since 1998 at the same time caseloads grew by 62 percent; increasingly complex cases and expensive residential placements explain much of the growth. − Enrollment has been relatively flat until recently. • Unprecedented fiscal policy actions were taken last session to facilitate placements in less expensive, community-based settings. S E F I C O 4 S F C E EN NA AT TE E IN NA AN NC CE E OM MM MI IT TT TE EE

  5. Policy Choices Also Contribute To Rising Spending • Current law -- state and federal -- dictate many fiscal policy decisions in health and human resources. • In Medicaid, the “forecast” recognizes the cost of continuing services based on anticipated changes in enrollment and per capita spending, which is a function of price, volume, and intensity. • Last week, a new Medicaid forecast was issued indicating that increased enrollment and rising costs will require an additional $325 million GF during the current biennium. − Last session, the General Assembly appropriated $352.3 million from the general fund to accommodate anticipated Medicaid growth. • Discretionary decisions reflect choices made to address ongoing or emerging policy issues. − Last session $41.6 million GF was appropriated to improve the Commonwealth’s civil commitment process and strengthen the community-based mental health system in the wake of the tragedy at Virginia Tech in April 2007. S E F I C O 5 S F C E EN NA AT TE E IN NA AN NC CE E OM MM MI IT TT TE EE

  6. Discretionary Spending on the Mental Retardation Waiver Program • Last year $41.6 million GF was appropriated to expand the mental retardation (MR) waiver program by: − Adding 600 mental retardation waiver slots; − Increasing provider rates by 3.6 percent; and − Allocating start-up funding for new waiver slots. • Since 1998, enrollment in the MR waiver program has more than doubled from 3,172 to 8,362 at a cost to the general fund of $172 million – a five-fold increase. General Fund Growth in the Mental Retardation Waiver Program $250 9,000 8,362 slots 8,000 $200 7,000 $216 million Dollars in millions 6,000 Number of slots $150 5,000 4,000 $100 3,000 3,172 slots 2,000 $50 1,000 $42 million $- - FY 1998 FY 2010 S E F I C O 6 S F C E EN NA AT TE E IN NA AN NC CE E OM MM MI IT TT TE EE

  7. HHR Spending Will Likely Continue To Rise • Medicaid is projected to grow 8.0 percent annually during the next ten years due to a combination of increasing enrollment, especially among the elderly and disabled, and rising per capita spending. − Because enrollment in Medicaid is counter-cyclical with the economy, caseloads are rising as the Commonwealth’s economic conditions worsen. • The cost of providing CSA services for children and youth is also expected to rise, exceeding 10 percent each year of the current biennium. • Higher spending on Medicaid and CSA combined with lower revenues will place additional financial pressure on other state programs. • As the largest program within HHR, Medicaid will likely be targeted for budget reductions. − What is Medicaid? − Who is enrolled and what services do enrollees receive? − How much has Medicaid grown and why? − What options are available to control rising costs? S E F I C O 7 S F C E EN NA AT TE E IN NA AN NC CE E OM MM MI IT TT TE EE

  8. Medicaid: Three Programs in One • Medicaid provides health and long-term care services to low-income Virginians. It is a: 1) Health insurance program for low-income families, primarily children and pregnant women; 2) Funding source for individuals with significant disabilities; and 3) Long-term care program for the elderly. State Spending on Medicaid (Dollars in millions) $3,500 $3,000 $3,111 $2,500 million $2,000 $1,500 $1,000 $1,164 $500 million $- FY 1998 FY 2010 • Medicaid spending growth trailed the national average from 1990 through 2004 but exceeded it from 2004 through 2006. S E F I C O 8 S F C E EN NA AT TE E IN NA AN NC CE E OM MM MI IT TT TE EE

  9. Virginia Spends Less on Medicaid Than Other States Medicaid Spending Compared to U.S. Average $4,662 $4,644 $5,000 $4,000 $3,000 $2,000 $1,028 $591 $1,000 $- Per capita Per enrollee Virginia US Average • Virginia ranks 48 th among its peers in terms of per capita Medicaid spending. − Fewer residents are enrolled in Medicaid (8.9 percent) compared to the U.S. average (15.0 percent). • Virginia ranks 31 st in Medicaid spending per enrollee, slightly less than the national average. S E F I C O 9 S F C E EN NA AT TE E IN NA AN NC CE E OM MM MI IT TT TE EE

  10. Who receives Medicaid? • The federal government requires states to serve certain mandated populations to receive matching funds. − A national survey found that 71 percent of Medicaid enrollees are mandatory. Mandatory Population Groups Aged, blind, or disabled Member of a family with children Low-income children and pregnant women Certain Medicare beneficiaries with incomes less than 135% of federal poverty guidelines (FPG) • Mandatory groups must also meet financial criteria (e.g., income and resource) to be eligible for Medicaid. • States that choose to expand coverage beyond “mandatory population groups” are eligible for federal Medicaid matching funds. Optional Population Groups “Medically needy” individuals whose income exceeds Medicaid limits but who are impoverished by medical bills Individuals who are at-risk of needing nursing home or an ICF-MR level of care without home- and community-based waiver services Aged, blind, or disabled with income under 80% of FPG Nursing home residents with income under 300% of SSI (221% of FPG) Children under 21 in foster homes, private institutions, or subsidized adoptions Women screened and diagnosed with breast or cervical cancer S E F I C O 10 S F C E EN NA AT TE E IN NA AN NC CE E OM MM MI IT TT TE EE

Download Presentation
Download Policy: The content available on the website is offered to you 'AS IS' for your personal information and use only. It cannot be commercialized, licensed, or distributed on other websites without prior consent from the author. To download a presentation, simply click this link. If you encounter any difficulties during the download process, it's possible that the publisher has removed the file from their server.

Recommend


More recommend