introduction
play

Introduction Recent growth in Health and Human Resources spending - PDF document

Introduction Recent growth in Health and Human Resources spending has been dominated by Medicaid, which tends to dwarf all other program spending in HHR. A one percent increase in Medicaid spending translates to $27 million in state


  1. Introduction • Recent growth in Health and Human Resources spending has been dominated by Medicaid, which tends to dwarf all other program spending in HHR. − A one percent increase in Medicaid spending translates to $27 million in state funds. 
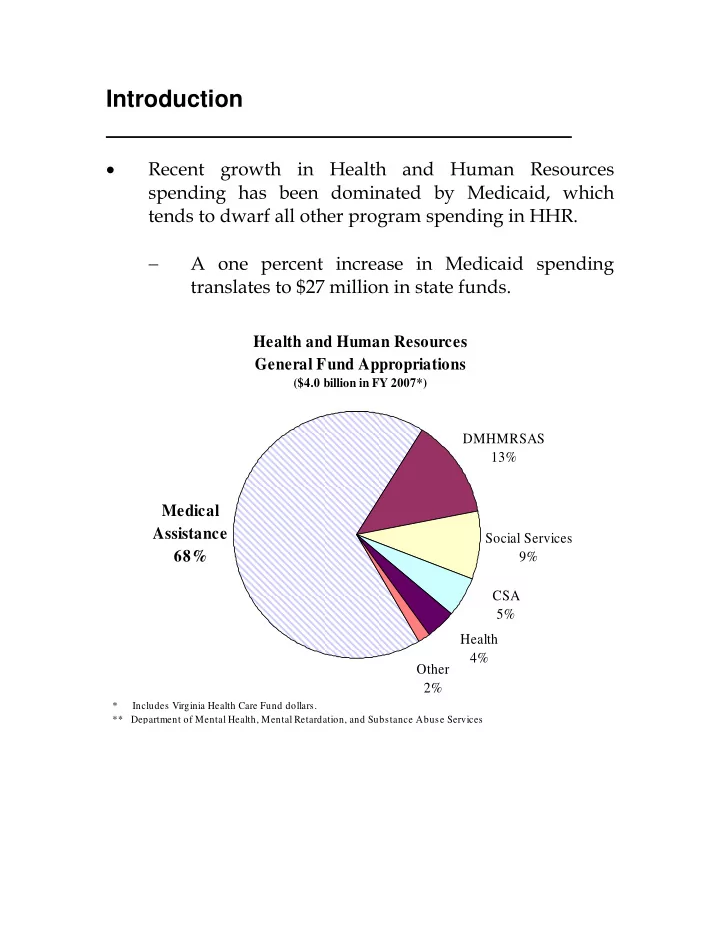
Health and Human Resources General Fund Appropriations ($4.0 billion in FY 2007*) DMHMRSAS 13% Medical Assistance Social Services 68% 9% CSA 5% Health 4% Other 2% * Includes Virginia Health Care Fund dollars. ** Department of Mental Health, Mental Retardation, and Substance Abuse Services

  2. Introduction (continued) • While much smaller than Medicaid, several HHR programs have grown at rapid clips in the past decade. Average Annual Expenditure Growth in Select Child Welfare Programs since FY 1996 18.0% 16.0% 16.7% 16.2% 14.0% 14.7% Percent growth 12.0% 10.0% 8.0% 7.6% 6.0% 4.0% 2.0% 0.0% Title IV-E Foster CSA Subsidized Adoptions Special Needs Care Adoptions • Declining caseloads and falling spending has made funding for the Temporary Assistance for Needy Families (TANF) program a non-issue in recent years. − Federal reauthorization of the TANF program earlier this year changed that. − Mandatory changes are expected to have a dramatic impact on the number of individuals required to engage in work activities, resulting in additional work-related and child care spending. • Recent growth in all of these programs has not gone unnoticed; the General Assembly has commissioned task forces and study groups to research and analyze program spending in order to recommend appropriate future action. S E F I C O 2 S F C E EN NA AT TE E IN NA AN NC CE E OM MM MI IT TT TE EE

  3. Introduction (continued) • An issue that has not received a lot of attention in recent years is substance abuse. − Substance abuse, in the form of alcohol and drug abuse, imposes hidden costs on many areas of state government. • In the only comprehensive analysis of state spending and substance abuse, it was estimated that 11.5 percent of the Commonwealth’s FY 1998 budget was spent “shoveling up” costs incurred from substance abuse. − Of each dollar spent on substance abuse, 95 cents was expended on the burden this problem imposes on public programs, translating into a cost of $261 per Virginian. − Approximately half of that spending was related to adult corrections, juvenile justice, and the judiciary. • Based on the current GF budget of $16.8 billion in FY 2007, the cost of substance abuse in Virginia translates into a $1.9 billion problem. • What is the impact of substance abuse on the Commonwealth’s programs? What are we doing about it? What more, if anything, needs to be done? S E F I C O 3 S F C E EN NA AT TE E IN NA AN NC CE E OM MM MI IT TT TE EE

  4. An Overview of Current Spending Trends in Health and Human Resources Medicaid � � CSA � Federal IV-E Foster Care � Adoption Assistance � TANF S E F I C O 4 S F C E EN NA AT TE E IN NA AN NC CE E OM MM MI IT TT TE EE

  5. Medicaid Virginia Medicaid Spending (Total dollars in millions) Projected $6,000 $5,405 $5,000 $4,000 $3,000 $2,253 $2,000 $1,000 $0 7 8 9 0 1 2 3 4 5 6 7 8 9 9 9 0 0 0 0 0 0 0 0 0 9 9 9 0 0 0 0 0 0 0 0 0 1 1 1 2 2 2 2 2 2 2 2 2 Y Y Y Y Y Y Y Y Y Y Y Y F F F F F F F F F F F F Sources: VA Medicaid Statistical Record and Preliminary Medicaid Forecast 2006. • Projected Medicaid spending is virtually unchanged from the end of the 2006 session, although there is considerable variation within spending categories. − Managed care payments rose less than expected due to slower enrollment and lower rate increases; and − Costs related to the new prescription drug benefit (Medicare Part D) were less than anticipated; but − Payments for dental services payments are up markedly and nursing home costs are increasing between 6 and 8 percent each year. S E F I C O 5 S F C E EN NA AT TE E IN NA AN NC CE E OM MM MI IT TT TE EE

  6. What is being done to address Medicaid? • DMAS assembled a committee made up of providers, advocates, health insurers, and program administrators to evaluate specific reform measures and make recommendations to the General Assembly. − Committee findings build on Medicaid’s strengths in managed care, expand disease management programs, and provide tools and incentives so providers and recipients can achieve optimal health outcomes. Recommendations include: Expanding managed care into new regions and across eligibility categories where feasible. Expanding population-based disease management programs for high cost and/or high prevalence diseases. Expanding participation in Medicaid and FAMIS “buy-in” programs where feasible and cost-effective. Providing access to enhanced benefit accounts to encourage recipients to assume responsibility for their own health care needs. Studying changes to current programs to encourage employer- sponsored or private health insurance coverage when it’s cost effective for Medicaid. Implementing a web-based claims submission system available free of charge to all healthcare providers. Requiring electronic payment of health care services to all enrolled Medicaid providers. S E F I C O 6 S F C E EN NA AT TE E IN NA AN NC CE E OM MM MI IT TT TE EE

  7. What is being done to address Medicaid? (continued) • DMAS is also developing a plan to integrate acute and long-term care services for individuals who are elderly and disabled that account for 30 percent of Medicaid recipients but 71 percent of expenditures. Medicaid Recipients and Expenditures (FY 2005) 2% 3% Foster Care Foster Care 9% Families Families 13% & children & children 18% Children under 21 Children 55% under 21 Blind & 71% of 45% disabled Expenditures Blind & 20% 30% of disabled 26% Recipients Aged Aged 10% Recipients Expenditures S E F I C O 7 S F C E EN NA AT TE E IN NA AN NC CE E OM MM MI IT TT TE EE

  8. What is being done to address Medicaid? (continued) • Start-up funding of $1.5 million GF was provided to establish Programs for All-Inclusive Care for the Elderly (PACE) in six locations across the state. − Two rural programs received start-up funding of $1.0 million from the federal government. − PACE programs integrate Medicaid funding with Medicare dollars to address the health and long- term care needs of the 55 and older population. • Compared to other sectors of the economy, the health care industry has largely missed out on the advancements in information technology. − DMAS is participating in the Governor’s Health Information Technology Council that includes goals of: � Identifying areas where information technology can lower health care costs; � Encouraging the adoption of electronic medical records; and � Recommending strategies to encourage sustained adoption and interoperability of health information technology. S E F I C O 8 S F C E EN NA AT TE E IN NA AN NC CE E OM MM MI IT TT TE EE

  9. Comprehensive Services Act for At-Risk Youth and Families (CSA) • CSA caseload growth has remained flat in recent years, averaging less than 2 percent annually, while spending has increased at a rate of 8 percent each year. − General fund support for CSA is expected to total $228 million in FY 2008. State Foster Care (CSA) Caseload and Expenditures Caseload Expenditures 20,000 $400 Budgeted 18,000 $350 Expenditures (in millions) 16,000 $300 14,000 $250 Caseload 12,000 10,000 $200 8,000 $150 6,000 $100 4,000 $50 2,000 - $- 1999 2000 2001 2002 2003 2004 2005 2006 2007 2008 NOTE: 2004 includes an estimate of 800 cases from two localities that did not report. • Seventy-eight percent of CSA expenditures fall into the following categories: − 31 percent for residential treatment. − 20 percent for special education day programs. − 16 percent for therapeutic foster care. − 11 percent for group homes. S E F I C O 9 S F C E EN NA AT TE E IN NA AN NC CE E OM MM MI IT TT TE EE

  10. What is being done to address CSA? • The 2006 General Assembly provided $1.3 million GF for Community Innovation Service Grants. − These competitive grants are designed to spur the development of community-based services for children who are placed or at risk of placement in more expensive, out of community residential care. • HJR 60 (2006) directed JLARC to review the cost, quality, and effectiveness of residential services as well as the availability of community-based alternatives to intensive residential treatment. − The final report will contain recommendations to control costs and ensure the provision of safe and effective treatment services. • Finally, SJR 96 (2006) created a subcommittee to review administration of the CSA program including caseloads, service needs, costs, and quality. − The subcommittee is expected to make recommendations on program improvements and cost containment. S E F I C O 10 S F C E EN NA AT TE E IN NA AN NC CE E OM MM MI IT TT TE EE

Download Presentation
Download Policy: The content available on the website is offered to you 'AS IS' for your personal information and use only. It cannot be commercialized, licensed, or distributed on other websites without prior consent from the author. To download a presentation, simply click this link. If you encounter any difficulties during the download process, it's possible that the publisher has removed the file from their server.

Recommend


More recommend