
SLIDE 1
UConn & UConn Health FY21 Spending Plans
1
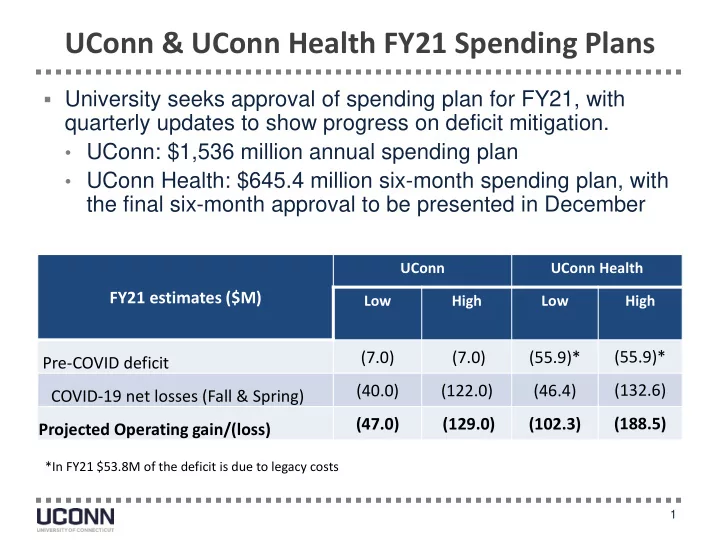
- University seeks approval of spending plan for FY21, with
quarterly updates to show progress on deficit mitigation.
- UConn: $1,536 million annual spending plan
- UConn Health: $645.4 million six-month spending plan, with
the final six-month approval to be presented in December
FY21 estimates ($M)
UConn UConn Health Low High Low High
Pre-COVID deficit (7.0) (7.0) (55.9)* (55.9)* COVID-19 net losses (Fall & Spring) (40.0) (122.0) (46.4) (132.6) Projected Operating gain/(loss) (47.0) (129.0) (102.3) (188.5)
*In FY21 $53.8M of the deficit is due to legacy costs