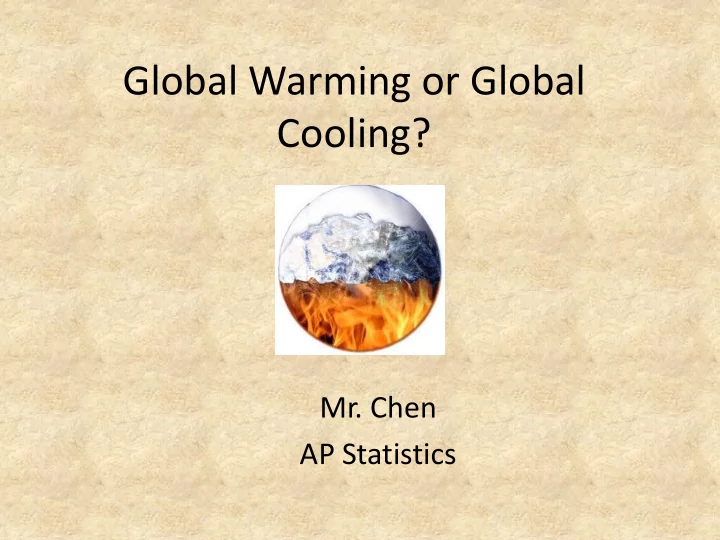
Global Warming or Global Cooling? Mr. Chen AP Statistics - - PowerPoint PPT Presentation

global warming or global cooling
SMART_READER_LITE
LIVE PREVIEW

Global Warming or Global Cooling? Mr. Chen AP Statistics - - PowerPoint PPT Presentation

Global Warming or Global Cooling? Mr. Chen AP Statistics California Standards 8.0 Students determine the mean and the standard deviation of a normally distributed random variable. 12.0 Students find the line of best fit to a given


slide-1
SLIDE 1

Global Warming or Global Cooling?

  • Mr. Chen

AP Statistics

slide-2
SLIDE 2

California Standards

  • 8.0 Students determine the mean and the standard deviation of a normally

distributed random variable.

  • 12.0 Students find the line of best fit to a given distribution of data by using least

squares regression.

  • 13.0 Students know what the correlation coefficient of two variables means and

are familiar with the coefficient’s properties.

  • 14.0 Students organize and describe distributions of data by using a number of

different methods, including frequency tables, histograms, standard line graphs and bar graphs, stem-and-leaf displays, scatterplots, and box-and-whisker plots.

  • 17.0 Students determine confidence intervals for a simple random sample from a

normal distribution of data and determine the sample size required for a desired margin of error.

  • 18.0 Students determine the P-value for a statistic for a simple random sample

from a normal distribution.

slide-3
SLIDE 3

Data: Temperature (Fahrenheit) New York City, December, 1995-2009

  • 1995 35.8
  • 1996 48.7
  • 1997 38.1
  • 1998 39.0
  • 1999 40.6
  • 2000 28.1
  • 2001 29.1
  • 2002 36.8
  • 2003 47.3
  • 2004 42.2
  • 2005 44.2
  • 2006 41.1
  • 2007 41.7
  • 2008 42.1
  • 2009 23.6

University of Dayton, Temperature Archive http://academic.udayton.edu/kissock/http/Weather/d efault.htm

slide-4
SLIDE 4

Hypothesis

  • We predict the average temperature for New

York City in December is 30⁰F, the standard deviation is 5⁰F.

  • There might be a very weak or no correlation

between time and temperature.

slide-5
SLIDE 5

Statistics

  • Sample mean, =38.56⁰F
  • Sample Standard Deviation, =7.0260⁰F
slide-6
SLIDE 6

Histogram

1 2 3 4 5 6 7 26.11 31.13 36.15 41.17 46.19 51.21 56.23 Frequency, f Temperature in December, Fahrenheit

New York, 1995-2009

slide-7
SLIDE 7

Confidence Interval for Population Mean:

We are 95% confident the population mean temperature of New York in December is between 34.76 to 42.51 degrees Fahrenheit with a marginal error of 3.8 degrees

slide-8
SLIDE 8

Confidence Interval for Population Standard Deviation:

We are 95% confident the population standard deviation is between 34.76 to 42.51 degrees Fahrenheit with a marginal error of 3.8 degrees

slide-9
SLIDE 9

Hypothesis Test for Mean

slide-10
SLIDE 10

Hypothesis Test for Standard Deviation

slide-11
SLIDE 11

Scatter Plot

10 20 30 40 50 60 1994 1996 1998 2000 2002 2004 2006 2008 2010 Temperature Year

New York City temperature in December

slide-12
SLIDE 12
slide-13
SLIDE 13

Linear Model: A linear regression approach, y=ax+b

Regression Line Equation y = -0.1479x + 334.57

For every one year increase in time, there is a drop of temperature of -0.1479 degrees Fahrenheit for the past 15 years

Correlation coefficient, r = -0.09411 and the coefficient of determination, is r² = 0.009 Only 0.9% of the variation in y (temperature) is explained by least- square regression of y (temperature) on x (year).

slide-14
SLIDE 14

Future Studies

  • Base on the data collected in this study, there is not

enough evidence to draw conclusion on the global temperature changes. The linear regression model shows the temperature is neither increasing nor

  • decreasing. The hypothesis testing for correlation

however suggests a possible correlation do exist. Future studies include looking at more data over a longer period of time, more cities around the world and a better regression model such as the Sine regression model.