
SLIDE 1
SEPTEMBER 14, 2016 SEDIMENT ASSESSMENT OF CASCO BAY (1991-2011)
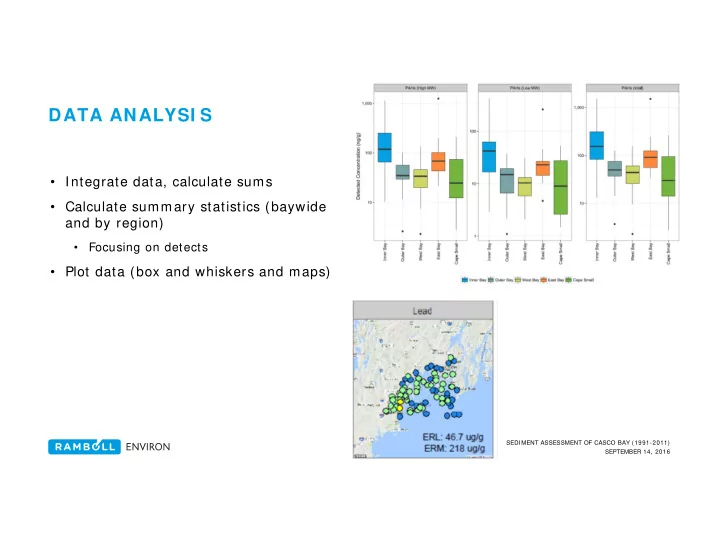
DATA ANALYSI S
- Integrate data, calculate sums
- Calculate summary statistics (baywide
and by region)
- Focusing on detects
- Plot data (box and whiskers and maps)