
SLIDE 1
www.galaxysurfactants.com
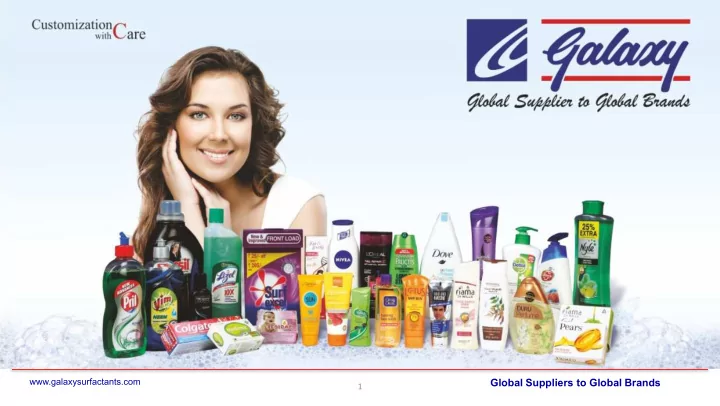
Global Suppliers to Global Brands
1
Global Suppliers to Global Brands 1 9/10 Indian consumers* use - - PowerPoint PPT Presentation
www.galaxysurfactants.com Global Suppliers to Global Brands 1 9/10 Indian consumers* use our ingredients at least once in their daily routine *who consume a toothpaste, shampoo, body wash www.galaxysurfactants.com Global Suppliers to
www.galaxysurfactants.com
Global Suppliers to Global Brands
1
www.galaxysurfactants.com
Global Suppliers to Global Brands
2
Indian consumers* use our ingredients at least once in their daily routine
*who consume a toothpaste, shampoo, body wash Global Supplier to Global Brands
GALAXY SURFACTANTS: A SNAPSHOT
Focus: Home and Personal Care Space Home Care: 150 Bn USD Beauty Care: 350 Bn USD Performance Surfactants and Specialty Care Products Addressable Ingredients Market: 5% 25-30 Bn USD Customers include MNC’s, Regional and Local Players 56% Galaxy’s T-1 Share 42% Global MNC Share HPC Industry 63:37 Revenue Share FY 1975 +
75+ Countries Supplied 1750+ Customers 37:63 Domestic:3
Global Supplier to Global Brands
THE 10 YEAR JOURNEY [FY 09 – FY 19]
GALAXY SURF ACTANTS DECADE GROWTH STOR Y VOLUMES(MT) EBITDA(Crs) PROFIT AFTER TAX (Crs) SPECIALTY REVENUE (Crs)4
Global Supplier to Global Brands
LEVERAGING THE TREND: SPECIALTY CARE
Preservatives Sales in 2009: 20 Crs Sales in 2019: 250 Crs 10Y CAGR: 28% Mild Surfactants Sales in 2009: Nil Sales in 2019: 100 Crs 40% Specialty Growth driven by Preservatives & Mild Surfactants Specialty Care Products Sales in 2009: 32 Crs Sales in 2019: 520 Crs 60% Specialty Growth driven by Developed Markets of USA & EU 37% 10Y CAGR: Preservatives and Mild Surfactants in US & EU5
www.galaxysurfactants.com
Global Suppliers to Global Brands
moms make their purchasing decisions for their kids
6
Global Supplier to Global Brands
EMERGING TRENDS, CATEGORIES & INNOVATION
Baby Care Segment Market Size: ~15 Bn USD GLI 21 & Mild Surfactants Application: Baby Shampoos & Top to Toe Naturals Segment Global Trend: Preference for natural in beauty products. N. Mild Surfactants and GLI 21 & Vegetable Proteins Facial Care Segment 100 Bn USD Market Today! Range7
Global Supplier to Global Brands
MONEY WHERE THE GROWTH IS!
The Niche Beauty Care Segment is buzzing with MNC/PE & VC activity given the huge opportunity that lies ahead..
Player Investor Info. Curatio ChrysCapital 20 Mn.$ Forest Essentials Estee Lauder Future Consumer IFC, V erlinvest 40 Mn.$ Mc Caf feine RP Goenka 2 Mn.$ Player Investor Info. W alker & Co, First Aid Beauty Snowberry Nz P&G Dec 2018 July 2018 Feb 2018 T reviso Nu Skin Enterprises 84.5 Mn $ (Feb 2018) Pulp Riot L'Oréal May 20188
Global Supplier to Global Brands
E-COMMERCE (ONLINE RETAIL) & BPC
E-Commerce PCS❑
USA: $ 3428❑
China: $ 1855❑
India: $ 205 Global E-Commerce Market to double in 4 Y ears from 2.2 T rillion USD in 2017 to 4.5 T rillion in 2021 Home and Personal Care: Online Share❑
USA: 18%❑
China: 34%❑
India: 6% Emergence9
www.galaxysurfactants.com
Global Suppliers to Global Brands
$6000 ) of a working age Chinese consumer is spent on personal care products , apparels and service
10
Global Supplier to Global Brands
INDIA CONSUMPTION STORY
▪
Income Growth▪
Rise▪
Poverty Reduction▪
Urbanisation DRIVERS▪
Concentrate▪
Unique & Highly Localised▪
Omni-Channel Presence▪
Niche Categories▪
Start Ups, Regional & Local Players MICRO-MARKET PLAYERS▪
Cosmetics, Facial Care, Baby Care & Men’s Grooming▪
50% incremental spending in HPC – Premiumisation▪
25% : New Products▪
25% : Existing products UPGRADATION BOOM▪
India to have 830 Million Inter net users by 2021▪
Online retail to be 4x by 2022▪
60% demand will come from Non Metro cities by 2022▪
Most active shoppers: 15-34 DIGITIZATION & E-COMM 6 Tr illion $ 2.5x Spend Consumption Expenditure by 2030 Forecasted Spend11
Global Supplier to Global Brands
CAPITALISING ON THE EMERGING NICHE
Emerging Categories: Baby Care, Face Care, Men’s Grooming, Af fordable Luxury Sulphate Free/ Paraben Free Ayurveda & Naturals Segment Online Retail/ Diversified Channel (Hotels & Phar ma) 4 Crs ~65 Crs 2009: Specialty Revenue 2019: Specialty Revenue 70 Crs ~5000 Crs 2009: India Baby Care Segment 2022: India Baby Care Segment 17% 2018-22: Growth Premium Beauty Care 2x India Facial Care Market In Last 5 Years ~11000 Crs 2018: India Facial Care MarketGalaxy today is present across all these customers & many more via its specialty..
13% 2018-22: Forecasted Growth Men’s Grooming12
Global Supplier to Global Brands
GALAXY’S EDGE
One Stop Shop Customised Solutions + Technical Expertise + Diverse Product Basket catering to all segments Reach & Global Customer Connect MNC’s + Regional Leaders + Niche Local Players & Start-ups Innovation & Trend▪
Right Product▪
Right Market▪
Right Application▪
Right Customers. For mula for sustainable growth Sustainable Manufacturing and Sourcing T o develop environment friendly green productsGALAXY IS READY FOR THE NEXT DECADE OF SUSTAINABLE GROWTH..
14
Global Supplier to Global Brands
Source of Information
Euro Monitor Mintel Future15
Global Supplier to Global Brands
THANK YOU
16