
SLIDE 1
Institute For New Economic Thinking
Too Much of the Wrong Sort of Capital Flow ¡|1 ¡
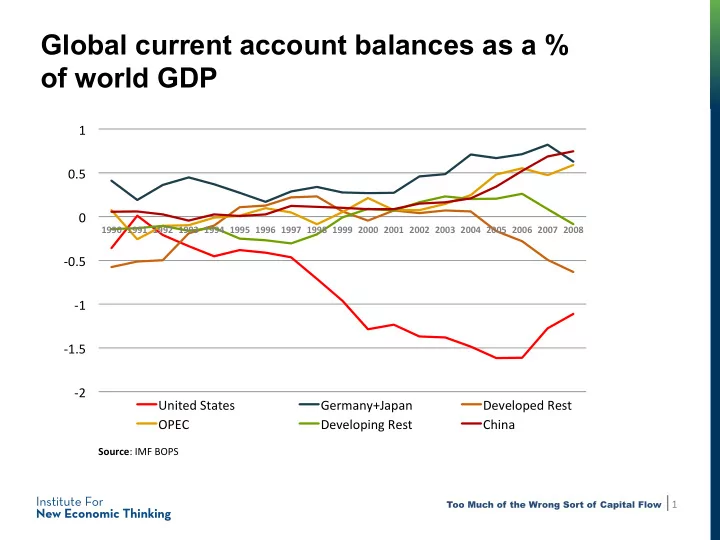
Global current account balances as a %
- f world GDP
- ‑2 ¡
- ‑1.5 ¡
- ‑1 ¡
- ‑0.5 ¡
0 ¡ 0.5 ¡ 1 ¡
1990 ¡ 1991 ¡ 1992 ¡ 1993 ¡ 1994 ¡ 1995 ¡ 1996 ¡ 1997 ¡ 1998 ¡ 1999 ¡ 2000 ¡ 2001 ¡ 2002 ¡ 2003 ¡ 2004 ¡ 2005 ¡ 2006 ¡ 2007 ¡ 2008 ¡
United ¡States ¡ Germany+Japan ¡ Developed ¡Rest ¡ OPEC ¡ Developing ¡Rest ¡ China ¡ ¡
Source: ¡IMF ¡BOPS ¡