
SLIDE 1
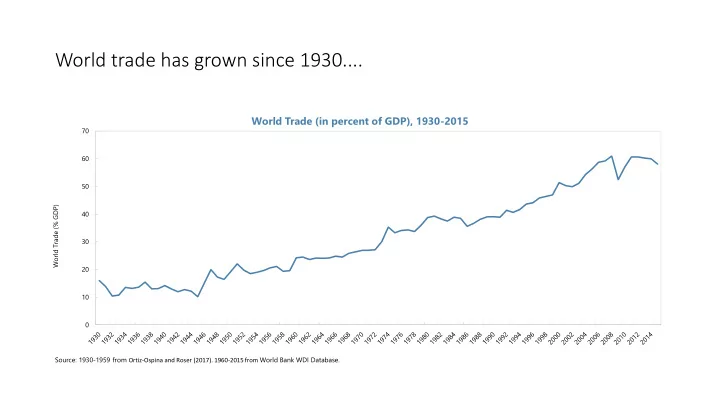
World trade has grown since 1930....
10 20 30 40 50 60 70 World Trade (% GDP)
World Trade (in percent of GDP), 1930-2015
Source: 1930-1959 from Ortiz-Ospina and Roser (2017). 1960-2015 from World Bank WDI Database.
World trade has grown since 1930.... World Trade (in percent of - - PowerPoint PPT Presentation
World trade has grown since 1930.... World Trade (in percent of GDP), 1930-2015 70 60 50 World Trade (% GDP) 40 30 20 10 0 Source: 1930-1959 from Ortiz-Ospina and Roser (2017). 1960-2015 from World Bank WDI Database. FDI and GDP ....
10 20 30 40 50 60 70 World Trade (% GDP)
World Trade (in percent of GDP), 1930-2015
Source: 1930-1959 from Ortiz-Ospina and Roser (2017). 1960-2015 from World Bank WDI Database.
500 1000 1500 2000 2500 3000 3500 4000 4500 5000 2 4 6 8 10 12 14 16 18 Luxembourg Mauritius Netherlands Hong Kong SAR Singapore Cyprus Ireland Hungary Switzerland Ratio of FDI/GDP Country share of world GDP (%) Country share of world FDI (%)