
SLIDE 1
Glaciers and ice sheets in a warming world
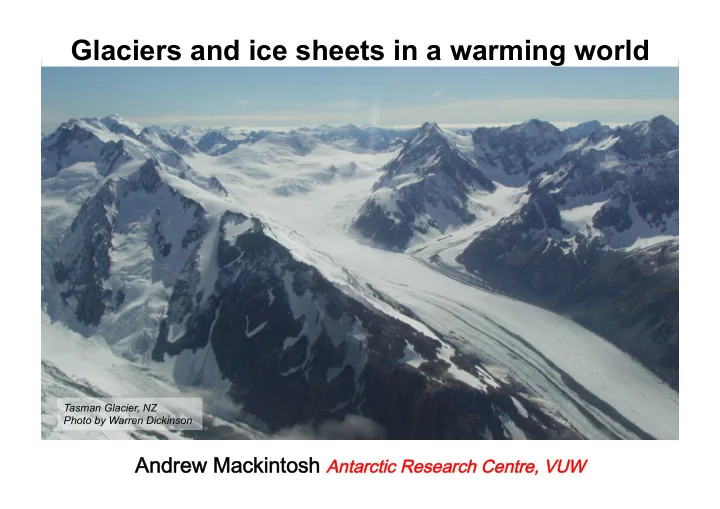
Andrew Mackintosh Antarctic Research Centre, VUW
Tasman Glacier, NZ Photo by Warren Dickinson
Glaciers and ice sheets in a warming world Tasman Glacier, NZ Photo - - PowerPoint PPT Presentation
Glaciers and ice sheets in a warming world Tasman Glacier, NZ Photo by Warren Dickinson Andrew Mackintosh Antarctic Research Centre, VUW background
Tasman Glacier, NZ Photo by Warren Dickinson
from Gornergrat, Switzerland
¡ ¡ ¡ ¡ ¡background ¡ ¡ ¡ ¡ ¡ ¡ ¡ ¡ ¡ ¡ ¡ ¡ ¡ ¡ ¡ ¡ ¡ ¡mountain ¡glaciers ¡ ¡ ¡ ¡ ¡ ¡ ¡ ¡ ¡ ¡ ¡ ¡ ¡ ¡ ¡ ¡ ¡ ¡ ¡ ¡ice ¡sheets ¡ ¡ ¡ ¡ ¡ ¡ ¡ ¡ ¡ ¡ ¡ ¡ ¡ ¡ ¡ ¡ ¡ ¡ ¡ ¡sea ¡level ¡
¡ ¡ ¡ ¡ ¡background ¡ ¡ ¡ ¡ ¡ ¡ ¡ ¡ ¡ ¡ ¡ ¡ ¡ ¡ ¡ ¡ ¡ ¡mountain ¡glaciers ¡ ¡ ¡ ¡ ¡ ¡ ¡ ¡ ¡ ¡ ¡ ¡ ¡ ¡ ¡ ¡ ¡ ¡ ¡ ¡ice ¡sheets ¡ ¡ ¡ ¡ ¡ ¡ ¡ ¡ ¡ ¡ ¡ ¡ ¡ ¡ ¡ ¡ ¡ ¡ ¡ ¡sea ¡level ¡
Oerlemans, 2005 Science
Rignot et al. Science 2011
¡ ¡ ¡ ¡ ¡background ¡ ¡ ¡ ¡ ¡ ¡ ¡ ¡ ¡ ¡ ¡ ¡ ¡ ¡ ¡ ¡ ¡ ¡mountain ¡glaciers ¡ ¡ ¡ ¡ ¡ ¡ ¡ ¡ ¡ ¡ ¡ ¡ ¡ ¡ ¡ ¡ ¡ ¡ ¡ ¡ice ¡sheets ¡ ¡ ¡ ¡ ¡ ¡ ¡ ¡ ¡ ¡ ¡ ¡ ¡ ¡ ¡ ¡ ¡ ¡ ¡ ¡sea ¡level ¡
Pritchard et al. Nature 2009
¡ ¡ ¡ ¡ ¡background ¡ ¡ ¡ ¡ ¡ ¡ ¡ ¡ ¡ ¡ ¡ ¡ ¡ ¡ ¡ ¡ ¡ ¡mountain ¡glaciers ¡ ¡ ¡ ¡ ¡ ¡ ¡ ¡ ¡ ¡ ¡ ¡ ¡ ¡ ¡ ¡ ¡ ¡ ¡ ¡ice ¡sheets ¡ ¡ ¡ ¡ ¡ ¡ ¡ ¡ ¡ ¡ ¡ ¡ ¡ ¡ ¡ ¡ ¡ ¡ ¡ ¡sea ¡level ¡
¡ ¡ ¡ ¡ ¡background ¡ ¡ ¡ ¡ ¡ ¡ ¡ ¡ ¡ ¡ ¡ ¡ ¡ ¡ ¡ ¡ ¡ ¡mountain ¡glaciers ¡ ¡ ¡ ¡ ¡ ¡ ¡ ¡ ¡ ¡ ¡ ¡ ¡ ¡ ¡ ¡ ¡ ¡ ¡ ¡ice ¡sheets ¡ ¡ ¡ ¡ ¡ ¡ ¡ ¡ ¡ ¡ ¡ ¡ ¡ ¡ ¡ ¡ ¡ ¡ ¡ ¡sea ¡level ¡
Velicogna Geophysical Research Letters 2009
1 mm/yr sea level rise
Updated from IPCC AR4 report by Dan Zwarz, ARC
¡ ¡ ¡ ¡ ¡ ¡ ¡background ¡ ¡ ¡ ¡ ¡ ¡ ¡ ¡ ¡ ¡ ¡ ¡ ¡ ¡ ¡ ¡ ¡ ¡mountain ¡glaciers ¡ ¡ ¡ ¡ ¡ ¡ ¡ ¡ ¡ ¡ ¡ ¡ ¡ ¡ ¡ ¡ ¡ ¡ ¡ ¡ ¡ ¡ ¡ ¡ ¡ ¡ ¡ ¡ ¡ ¡ ¡ice ¡sheets ¡ ¡ ¡ ¡ ¡ ¡ ¡ ¡ ¡ ¡ ¡ ¡ ¡ ¡ ¡ ¡ ¡ ¡ ¡ ¡sea ¡level ¡
from Gornergrat, Switzerland
¡ ¡ ¡ ¡ ¡backround ¡ ¡ ¡ ¡ ¡ ¡ ¡ ¡ ¡ ¡ ¡ ¡ ¡ ¡ ¡ ¡ ¡ ¡mountain ¡glaciers ¡ ¡ ¡ ¡ ¡ ¡ ¡ ¡ ¡ ¡ ¡ ¡ ¡ ¡ ¡ ¡ ¡ ¡ ¡ ¡ice ¡sheets ¡ ¡ ¡ ¡ ¡ ¡ ¡ ¡ ¡ ¡ ¡ ¡ ¡ ¡ ¡ ¡ ¡ ¡ ¡ ¡sea ¡level ¡
Out of 442 glaciers examined by the WGMS in 2005, 26 were advancing, 18 were stationary and 398 were retreating Of the 26 advancing glaciers,15 were located in New Zealand
¡ ¡ ¡ ¡ ¡ ¡ ¡background ¡ ¡ ¡ ¡ ¡ ¡ ¡ ¡ ¡ ¡ ¡ ¡ ¡ ¡ ¡ ¡mountain ¡glaciers ¡ ¡ ¡ ¡ ¡ ¡ ¡ ¡ ¡ ¡ ¡ ¡ ¡ ¡ ¡ ¡ ¡ ¡ ¡ ¡ ¡ice ¡sheets ¡ ¡ ¡ ¡ ¡ ¡ ¡ ¡ ¡ ¡ ¡ ¡ ¡ ¡ ¡ ¡ ¡ ¡sea ¡level ¡
IPCC AR4 WG1: ‘As with coastal Scandinavia, glaciers in the New Zealand Alps advanced during the 1990s, but have started to shrink since 2000. Increased precipitation may have caused the glacier growth (Chinn et al., 2005).’ IPCC AR4 WG2: ‘Numerical modelling of the Franz Josef glacier reveals that temperature is the dominant control on glacier length for New Zealand’s maritime glaciers. Noticeable shrinkage and retreat is very likely for even small temperature increases (Anderson et al. 2004, Anderson and Mackintosh, 2006). ¡ ¡ ¡ ¡ ¡ ¡ ¡background ¡ ¡ ¡ ¡ ¡ ¡ ¡ ¡ ¡ ¡ ¡ ¡ ¡ ¡ ¡ ¡mountain ¡glaciers ¡ ¡ ¡ ¡ ¡ ¡ ¡ ¡ ¡ ¡ ¡ ¡ ¡ ¡ ¡ ¡ ¡ ¡ ¡ ¡ ¡ice ¡sheets ¡ ¡ ¡ ¡ ¡ ¡ ¡ ¡ ¡ ¡ ¡ ¡ ¡ ¡ ¡ ¡ ¡ ¡sea ¡level ¡
Glacier mass balance and climate data for constraining and evaluating models ¡ ¡ ¡ ¡ ¡ ¡ ¡background ¡ ¡ ¡ ¡ ¡ ¡ ¡ ¡ ¡ ¡ ¡ ¡ ¡ ¡ ¡ ¡mountain ¡glaciers ¡ ¡ ¡ ¡ ¡ ¡ ¡ ¡ ¡ ¡ ¡ ¡ ¡ ¡ ¡ ¡ ¡ ¡ ¡ ¡ ¡ice ¡sheets ¡ ¡ ¡ ¡ ¡ ¡ ¡ ¡ ¡ ¡ ¡ ¡ ¡ ¡ ¡ ¡ ¡ ¡sea ¡level ¡
Mass balance 2009/10 (m w.e.) 10 6 2 -2 -6 -10 -14 ¡ ¡ ¡ ¡ ¡ ¡ ¡background ¡ ¡ ¡ ¡ ¡ ¡ ¡ ¡ ¡ ¡ ¡ ¡ ¡ ¡ ¡ ¡mountain ¡glaciers ¡ ¡ ¡ ¡ ¡ ¡ ¡ ¡ ¡ ¡ ¡ ¡ ¡ ¡ ¡ ¡ ¡ ¡ ¡ ¡ ¡ice ¡sheets ¡ ¡ ¡ ¡ ¡ ¡ ¡ ¡ ¡ ¡ ¡ ¡ ¡ ¡ ¡ ¡ ¡ ¡sea ¡level ¡
Anderson and Mackintosh, 2011 JGR
¡ ¡ ¡ ¡ ¡ ¡ ¡background ¡ ¡ ¡ ¡ ¡ ¡ ¡ ¡ ¡ ¡ ¡ ¡ ¡ ¡ ¡ ¡mountain ¡glaciers ¡ ¡ ¡ ¡ ¡ ¡ ¡ ¡ ¡ ¡ ¡ ¡ ¡ ¡ ¡ ¡ ¡ ¡ ¡ ¡ ¡ice ¡sheets ¡ ¡ ¡ ¡ ¡ ¡ ¡ ¡ ¡ ¡ ¡ ¡ ¡ ¡ ¡ ¡ ¡ ¡sea ¡level ¡
NASA GISS Surface Temperature anomaly, 1982-1983 ¡ ¡ ¡ ¡ ¡ ¡ ¡background ¡ ¡ ¡ ¡ ¡ ¡ ¡ ¡ ¡ ¡ ¡ ¡ ¡ ¡ ¡ ¡mountain ¡glaciers ¡ ¡ ¡ ¡ ¡ ¡ ¡ ¡ ¡ ¡ ¡ ¡ ¡ ¡ ¡ ¡ ¡ ¡ ¡ ¡ ¡ice ¡sheets ¡ ¡ ¡ ¡ ¡ ¡ ¡ ¡ ¡ ¡ ¡ ¡ ¡ ¡ ¡ ¡ ¡ ¡sea ¡level ¡
15 m sea-level rise in ~ 500 years from c. 14.6 ka (E. Bard INQUA 2011.)
¡ ¡ ¡ ¡ ¡ ¡ ¡background ¡ ¡ ¡ ¡ ¡ ¡ ¡ ¡ ¡ ¡ ¡ ¡ ¡ ¡ ¡ ¡ ¡ ¡mountain ¡glaciers ¡ ¡ ¡ ¡ ¡ ¡ ¡ ¡ ¡ ¡ ¡ ¡ ¡ ¡ ¡ ¡ ¡ ¡ ¡ ¡ ¡ ¡ ¡ ¡ ¡ ¡ ¡ ¡ ¡ ¡ ¡ice ¡sheets ¡ ¡ ¡ ¡ ¡ ¡ ¡ ¡ ¡ ¡ ¡ ¡ ¡ ¡ ¡ ¡ ¡ ¡ ¡ ¡sea ¡level ¡
Source: http://www.globalwarmingart.com/
‘..the southern Laurentide Ice Sheet could not have been the sole source of the meltwater pulse…. …a substantial contribution from the Antarctic Ice Sheet is consistent with these records.’
Clark et al. 2002 Science
¡ ¡ ¡ ¡ ¡ ¡ ¡background ¡ ¡ ¡ ¡ ¡ ¡ ¡ ¡ ¡ ¡ ¡ ¡ ¡ ¡ ¡ ¡ ¡ ¡mountain ¡glaciers ¡ ¡ ¡ ¡ ¡ ¡ ¡ ¡ ¡ ¡ ¡ ¡ ¡ ¡ ¡ ¡ ¡ ¡ ¡ ¡ ¡ ¡ ¡ ¡ ¡ ¡ ¡ ¡ ¡ ¡ ¡ice ¡sheets ¡ ¡ ¡ ¡ ¡ ¡ ¡ ¡ ¡ ¡ ¡ ¡ ¡ ¡ ¡ ¡ ¡ ¡ ¡ ¡sea ¡level ¡
If MWP1a came from Antarctica then we would require;
¡ ¡ ¡ ¡ ¡ ¡ ¡background ¡ ¡ ¡ ¡ ¡ ¡ ¡ ¡ ¡ ¡ ¡ ¡ ¡ ¡ ¡ ¡ ¡ ¡mountain ¡glaciers ¡ ¡ ¡ ¡ ¡ ¡ ¡ ¡ ¡ ¡ ¡ ¡ ¡ ¡ ¡ ¡ ¡ ¡ ¡ ¡ ¡ ¡ ¡ ¡ ¡ ¡ ¡ ¡ ¡ ¡ ¡ice ¡sheets ¡ ¡ ¡ ¡ ¡ ¡ ¡ ¡ ¡ ¡ ¡ ¡ ¡ ¡ ¡ ¡ ¡ ¡ ¡ ¡sea ¡level ¡
Rignot et al. Science 2011
Mackintosh et al. 2011 Nature Geoscience
¡ ¡ ¡ ¡ ¡ ¡ ¡background ¡ ¡ ¡ ¡ ¡ ¡ ¡ ¡ ¡ ¡ ¡ ¡ ¡ ¡ ¡ ¡ ¡ ¡mountain ¡glaciers ¡ ¡ ¡ ¡ ¡ ¡ ¡ ¡ ¡ ¡ ¡ ¡ ¡ ¡ ¡ ¡ ¡ ¡ ¡ ¡ ¡ ¡ ¡ ¡ ¡ ¡ ¡ ¡ ¡ ¡ ¡ice ¡sheets ¡ ¡ ¡ ¡ ¡ ¡ ¡ ¡ ¡ ¡ ¡ ¡ ¡ ¡ ¡ ¡ ¡ ¡ ¡ ¡sea ¡level ¡
Mackintosh et al. 2011 Nature Geoscience
Sea level rise Ocean warming
¡ ¡ ¡ ¡ ¡ ¡ ¡background ¡ ¡ ¡ ¡ ¡ ¡ ¡ ¡ ¡ ¡ ¡ ¡ ¡ ¡ ¡ ¡ ¡ ¡mountain ¡glaciers ¡ ¡ ¡ ¡ ¡ ¡ ¡ ¡ ¡ ¡ ¡ ¡ ¡ ¡ ¡ ¡ ¡ ¡ ¡ ¡ ¡ ¡ ¡ ¡ ¡ ¡ ¡ ¡ ¡ ¡ ¡ice ¡sheets ¡ ¡ ¡ ¡ ¡ ¡ ¡ ¡ ¡ ¡ ¡ ¡ ¡ ¡ ¡ ¡ ¡ ¡ ¡ ¡sea ¡level ¡
from Gornergrat, Switzerland
¡ ¡ ¡ ¡ ¡ ¡ ¡background ¡ ¡ ¡ ¡ ¡ ¡ ¡ ¡ ¡ ¡ ¡ ¡ ¡ ¡ ¡ ¡ ¡ ¡mountain ¡glaciers ¡ ¡ ¡ ¡ ¡ ¡ ¡ ¡ ¡ ¡ ¡ ¡ ¡ ¡ ¡ ¡ ¡ ¡ ¡ ¡ ¡ ¡ ¡ ¡ ¡ ¡ ¡ ¡ ¡ ¡ ¡ice ¡sheets ¡ ¡ ¡ ¡ ¡ ¡ ¡ ¡ ¡ ¡ ¡ ¡ ¡ ¡ ¡ ¡ ¡ ¡ ¡ ¡sea ¡level ¡
Tasman Glacier, New Zealand
Reconstructing climate or projecting glacier response requires knowledge of glacier mass balance sensitivity http://www.ipcc.ch/publications_and_data/ar4/wg1/en/ch10s10-6-3-1.html
Oerlemans 2005 Science
¡ ¡ ¡ ¡ ¡ ¡ ¡background ¡ ¡ ¡ ¡ ¡ ¡ ¡ ¡ ¡ ¡ ¡ ¡ ¡ ¡ ¡ ¡ ¡ ¡mountain ¡glaciers ¡ ¡ ¡ ¡ ¡ ¡ ¡ ¡ ¡ ¡ ¡ ¡ ¡ ¡ ¡ ¡ ¡ ¡ ¡ ¡ ¡ ¡ ¡ ¡ ¡ ¡ ¡ ¡ ¡ ¡ ¡ice ¡sheets ¡ ¡ ¡ ¡ ¡ ¡ ¡ ¡ ¡ ¡ ¡ ¡ ¡ ¡ ¡ ¡ ¡ ¡ ¡ ¡sea ¡level ¡
Mass balance 2009/10 (m w.e.) 10 6 2 -2 -6 -10 -14 ¡ ¡ ¡ ¡ ¡ ¡ ¡background ¡ ¡ ¡ ¡ ¡ ¡ ¡ ¡ ¡ ¡ ¡ ¡ ¡ ¡ ¡ ¡ ¡ ¡mountain ¡glaciers ¡ ¡ ¡ ¡ ¡ ¡ ¡ ¡ ¡ ¡ ¡ ¡ ¡ ¡ ¡ ¡ ¡ ¡ ¡ ¡ ¡ ¡ ¡ ¡ ¡ ¡ ¡ ¡ ¡ ¡ ¡ice ¡sheets ¡ ¡ ¡ ¡ ¡ ¡ ¡ ¡ ¡ ¡ ¡ ¡ ¡ ¡ ¡ ¡ ¡ ¡ ¡ ¡sea ¡level ¡
¡ ¡ ¡ ¡ ¡ ¡ ¡background ¡ ¡ ¡ ¡ ¡ ¡ ¡ ¡ ¡ ¡ ¡ ¡ ¡ ¡ ¡ ¡ ¡ ¡mountain ¡glaciers ¡ ¡ ¡ ¡ ¡ ¡ ¡ ¡ ¡ ¡ ¡ ¡ ¡ ¡ ¡ ¡ ¡ ¡ ¡ ¡ ¡ ¡ ¡ ¡ ¡ ¡ ¡ ¡ ¡ ¡ ¡ice ¡sheets ¡ ¡ ¡ ¡ ¡ ¡ ¡ ¡ ¡ ¡ ¡ ¡ ¡ ¡ ¡ ¡ ¡ ¡ ¡ ¡sea ¡level ¡
Anderson and Mackintosh, 2011 Journal of Geophysical Research (Earth Surface). In press and available online.
¡ ¡ ¡ ¡ ¡ ¡ ¡background ¡ ¡ ¡ ¡ ¡ ¡ ¡ ¡ ¡ ¡ ¡ ¡ ¡ ¡ ¡ ¡ ¡ ¡mountain ¡glaciers ¡ ¡ ¡ ¡ ¡ ¡ ¡ ¡ ¡ ¡ ¡ ¡ ¡ ¡ ¡ ¡ ¡ ¡ ¡ ¡ ¡ ¡ ¡ ¡ ¡ ¡ ¡ ¡ ¡ ¡ ¡ice ¡sheets ¡ ¡ ¡ ¡ ¡ ¡ ¡ ¡ ¡ ¡ ¡ ¡ ¡ ¡ ¡ ¡ ¡ ¡ ¡ ¡sea ¡level ¡
Mean annual precipitation (ma-1) Debris covered area (%)
r2=0.26 r2=0.50
Anderson and Mackintosh, 2011 JGR
Anderson and Mackintosh, 2011 JGR
¡ ¡ ¡ ¡ ¡ ¡ ¡background ¡ ¡ ¡ ¡ ¡ ¡ ¡ ¡ ¡ ¡ ¡ ¡ ¡ ¡ ¡ ¡ ¡ ¡mountain ¡glaciers ¡ ¡ ¡ ¡ ¡ ¡ ¡ ¡ ¡ ¡ ¡ ¡ ¡ ¡ ¡ ¡ ¡ ¡ ¡ ¡ ¡ ¡ ¡ ¡ ¡ ¡ ¡ ¡ ¡ ¡ ¡ice ¡sheets ¡ ¡ ¡ ¡ ¡ ¡ ¡ ¡ ¡ ¡ ¡ ¡ ¡ ¡ ¡ ¡ ¡ ¡ ¡ ¡sea ¡level ¡
Mass balance gradient (mm m-1) Mass balance amplitude (m.w.e.)
r2=0.61 r2=0.67
Mt Tasman and Mt Cook, NZ
¡ ¡ ¡ ¡ ¡ ¡ ¡background ¡ ¡ ¡ ¡ ¡ ¡ ¡ ¡ ¡ ¡ ¡ ¡ ¡ ¡ ¡ ¡ ¡ ¡mountain ¡glaciers ¡ ¡ ¡ ¡ ¡ ¡ ¡ ¡ ¡ ¡ ¡ ¡ ¡ ¡ ¡ ¡ ¡ ¡ ¡ ¡ ¡ ¡ ¡ ¡ ¡ ¡ ¡ ¡ ¡ ¡ ¡ice ¡sheets ¡ ¡ ¡ ¡ ¡ ¡ ¡ ¡ ¡ ¡ ¡ ¡ ¡ ¡ ¡ ¡ ¡ ¡ ¡ ¡sea ¡level ¡ What we still don’t understand Regional climate variability and its influence on both glaciers and ice sheets Distribution and volume of present-day glaciers Important physical processes and boundary conditions in ice sheet models