
SLIDE 1
Glaciology
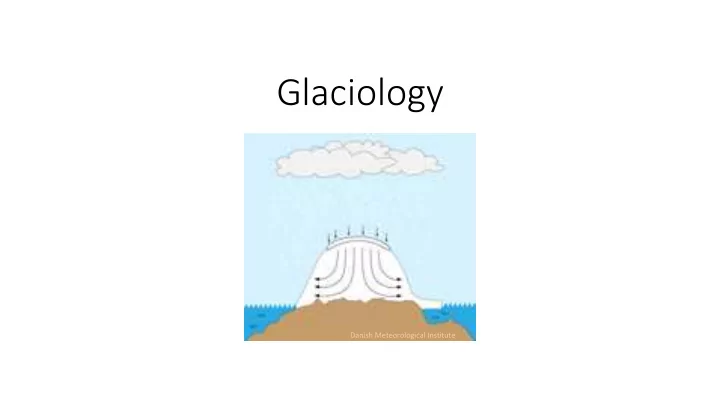
Danish Meteorological Institute
Glaciology Danish Meteorological Institute Glaciers NASA Ice - - PowerPoint PPT Presentation
Glaciology Danish Meteorological Institute Glaciers NASA Ice Sheets Modern glaciology Satellite remote sensing and the first large scale ice sheet models came online in the early 1990s Three main satellite data products: ice
Danish Meteorological Institute
NASA
Rignot et al 2011, Science
(Launch Date: September 15, 2018 5:46am PDT)
Gravity Altimetry Radar Multispectral imagery “Many of the measurements still routinely taken differ only in the speed and accuracy with which they can now be made.” (Clarke, 1987)
Randolph Glacier Inventory
important quantities (ice velocity, ice surface height). Fully appreciating these datasets will be a major growth area in glaciology for at least a decade.
topography, meteorological measurements, geothermal heat flux, long time series of anything)
Operation Ice Bridge
Operation Ice Bridge Greenland Antarctica (Vostok, figure from Wikipedia)
(thickness/accumulation rate), which for Antarctica is about 104 or 106 years.
8 weeks (and maybe much faster, the observations are coarse in time).
NASA EarthObservatory NASA EarthObservatory
The grounding line instability has been a central focus of ice sheet glaciology for the last 40 years. Recent work has emphasized stabilizing mechanisms:
water
Controversially, we could ask, is the grounding line instability relevant to real ice sheets?
(Credit: Valentina R. Barletta, CC-BY)
margins of large ice sheets?
water pressure and the bed substrate are essential.
SwissEduc JPL NASA
margins of large ice sheets?
water pressure and the bed substrate are essential.
SwissEduc JPL NASA
Thermal expansion Glaciers Greenland Antarctica Land water storage
10 20 30 40
Sea Level Rise Uncertainty Millimeters per century
Fast ice dynamics Surface mass balance
Other
AR5
Rempel 2008 SwissEduc
An extreme melt event in Greenland in 2012 has been interpreted as a potential window into future conditions. What caused this melting? Low level clouds have been implicated.
downgoing infrared flux to the ice surface, yet
radiation to reach the surface
slope winds that are driven by advection through a background lapse rate and the resulting buoyant acceleration.
katabatic winds describe the majority of the annual wind field.
with extreme wind scour. (Image about 200km wide)
20 1000 500 1000 1000 2000 3000 2000 1500 1000 500
CO CO LIA LIA
Temperature (°C)
A B C D
Temperature (°C) Depth (m) Depth (m) GRIP Temperature Profile 1995 Dye 3 Temperature Profile 1983
directly constrain past surface temperatures, here showing (insets) the Little Ice Age (LIA) and the Holocene Climate Optimum (CO).
data requires a thermal evolution model based on heat conduction, advection, and climate forcing.
are observed to have the greatest fractional mass loss.
Earth, as is observed to have the smallest fractional change.
Antarctic Ice Sheet mass loss? What changes are attributable to human activity?
IMBIE Report, 2018 AR5 AR5 Mountain Glaciers