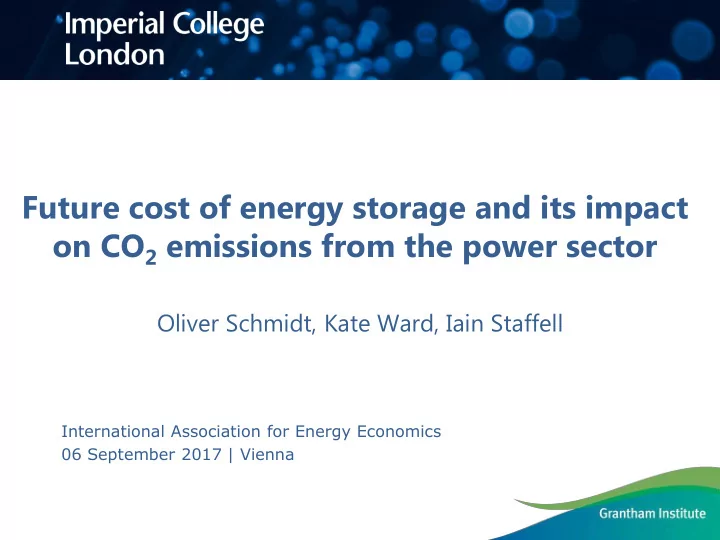
Future cost of energy storage and its impact
- n CO2 emissions from the power sector
Oliver Schmidt, Kate Ward, Iain Staffell
International Association for Energy Economics 06 September 2017 | Vienna
Future cost of energy storage and its impact on CO 2 emissions from - - PowerPoint PPT Presentation
Future cost of energy storage and its impact on CO 2 emissions from the power sector Oliver Schmidt, Kate Ward, Iain Staffell International Association for Energy Economics 06 September 2017 | Vienna Experience curves are a scientific tool to
International Association for Energy Economics 06 September 2017 | Vienna
1976 2015 100 1.000 10.000 100.000 0,001 0,01 0,1 1 10 100 1.000 Product Price (US$2015/kW) Cumulative Installed Capacity GW)
2 Solar PV (23%, Module)
Source: Liebreich, M. Keynote - Bloomberg New Energy Finance Summit 2016. (Bloomberg New Energy Finance, 2016).
3
Source: O. Schmidt, A. Hawkes, A. Gambhir & I. Staffell. The future cost of electrical energy storage based on experience rates. Nat. Energy 2, 17110 (2017)
50 100 200 500 1.000 2.000 5.000 10.000 20.000 0,001 0,01 0,1 1 10 100 1.000 10.000
1983 2013 1989 2012 2013 2016 1995 2011 2013 2016 2010 2015 1997 2014 2007 2015 2008 2015 1956 2014 2004 2015
Product Price (US$2015/kWhcap) Cumulative Installed Nominal Capacity (GWhcap)
Pumped hydro (Utility, -1±8%) Lead-acid (Multiple, 4±6%) Lead-acid (Residential, 13±5%) Lithium-ion (Electronics, 30±3%) Lithium-ion (EV, 16±4%) Lithium-ion (Residential, 12±4%) Lithium-ion (Utility, 12±3%) Nickel-metal hydride (HEV, 11±1%) Sodium-sulfur (Utility, -) Vanadium redox-flow (Utility, 11±9%) Electrolysis (Utility, 18±6%) Fuel Cells (Residential, 18±2%) System Pack Module Battery
4 50 100 200 500 1.000 2.000 5.000 10.000 20.000 0,001 0,01 0,1 1 10 100 1.000 10.000 Product Price (US$2015/kWhcap) Cumulative Installed Nominal Capacity (GWhcap)
Pumped hydro (Utility, -1±8%) Lead-acid (Multiple, 4±6%) Lead-acid (Residential, 13±5%) Lithium-ion (Electronics, 30±3%) Lithium-ion (EV, 16±4%) Lithium-ion (Residential, 12±4%) Lithium-ion (Utility, 12±3%) Nickel-metal hydride (HEV, 11±1%) Vanadium redox-flow (Utility, 11±9%) Electrolysis (Utility, 18±6%) Fuel Cells (Residential, 18±2%) System Pack Module Battery
Source: O. Schmidt, A. Hawkes, A. Gambhir & I. Staffell. The future cost of electrical energy storage based on experience rates. Nat. Energy 2, 17110 (2017)
280-400 150-200 135 Price ranges
5 200 400 600 800 1.000 1.200 1.400 2015 2020 2025 2030 2035 2040 Product Price (US$2015/kWhcap) Lithium-ion (Utility, 12±3%, System) Experience Rate uncertainty + Growth Rate uncertainty 740 $/kWh 290 $/kWh 460 $/kWh
Source: O. Schmidt, A. Hawkes, A. Gambhir & I. Staffell. The future cost of electrical energy storage based on experience rates. Nat. Energy 2, 17110 (2017)
6
20 40 60 80 100 120 140 160 180 200 1960 1980 2000 2020 2040 2060 Installed Capacity (GW) Storage Solar Wind OCGT CCGT CCS CCGT Coal CCS Coal Nuclear 100 200 300 400 500 600 1960 1980 2000 2020 2040 2060 Energy Output (TWh) 20 40 60 80 100 120 140 160 180 200 1960 1980 2000 2020 2040 2060 Installed Capacity (GW) Solar Wind OCGT Gas CCS Gas Coal CCS Coal Nuclear 100 200 300 400 500 600 1960 1980 2000 2020 2040 2060 Energy Output (TWh)
Baseline Storage Carbon Price: 200 £/ton Strike Price: 89.5 £/MWh Renewables: 70 GW Curtailed: 159 TWh Emissions: 3.14 GT Net Spend: £113 bn Storage capacity: 14 GW (20%) Storage duration: 6 hours Storage efficiency: 75% Curtailed: 117 TWh (-25%) Emissions: 2.94 GT (-6%) Net Spend: £130 bn
2010 - 2060 2050 2010 - 2060 2050
Source: Own analysis
7
0% 2% 4% 6% 8% 10% 12% 0% 10% 20% 30% 40% 50% 60% 70% 80% 90% 100% 0% 5% 10% 15% 20% 25% 30% Abatement (relative) Curtailed Energy (relative) Energy Storage Penetration (% of Renewables) 0% 2% 4% 6% 8% 10% 12% 0% 10% 20% 30% 40% 50% 60% 70% 80% 90% 100% 5 10 15 20 Abatement (relative) Curtailed Energy (relative) Storage Duration (hours)
Penetration Storage duration The impact of storage duration on curtailment reduction and abatement improvement appears more pronounced than that of higher storage penetration
@ 6 hours, 75%AC-AC @ 20%Share, 75%AC-AC
Source: Own analysis
+6%
+6%
50 100 150 200 250 100 200 300 400 500 600 700 800 900 1000 1100 1200 1300 1400 1500 1600 1700 1800 1900 2000 2100 2200 2300 2400 2500 2600 2700 Marginal abatement cost ($/tCO2) Abatement Potential (MTCO2)
PtG5 PtG10 PtG15 PtG20 PtG30 Redox5 Redox20 Redox15 Redox10 Redox30 Li-ion5 Li-ion10 Li-ion15 Li-ion20 Li-ion30
8 ~300
Source: Own analysis
PtG Redox Li-ion Duration 20h 6h 3h Efficiency 30% 75% 85% Lifetime 15y 15y 15y
Oliver Schmidt | PhD Researcher in Energy Storage Grantham Institute - Climate Change and the Environment Imperial College London, Exhibition Road, London SW7 2AZ Tel: +44 (0) 7934548736 Email: o.schmidt15@imperial.ac.uk Website: www.storage-lab.com
10
Source: M. Hiremath, K. Derendorf, T. Vogt, Comparative life cycle assessment of battery storage systems for stationary applications., Environ. Sci. Technol. 49 (2015) 4825–33. doi:10.1021/es504572q.
11
250 500 750 1.000 1.250 1.500 1.750 2.000 2015 2020 2025 2030 2035 2040 Product Price (US$2015/kWhcap) Fuel cells (Residential, 18±2%, Pack) Experience Rate uncertainty + Growth Rate uncertainty 200 400 600 800 1.000 1.200 1.400 1.600 1.800 2.000 2015 2020 2025 2030 2035 2040 Product Price (US$2015/kWhcap) Redox-flow (Utility, 11±9%, System) Experience Rate uncertainty + Growth Rate uncertainty 60 80 100 120 140 160 180 200 2015 2020 2025 2030 2035 2040 Product Price (US$2015/kWhcap) Electrolysis (Utility, 18±6%, Pack) Experience Rate uncertainty + Growth Rate uncertainty
12 0,001 0,01 0,1 1 10 100 1.000 10.000 Cumulative Installed Nominal Capacity (GWhcap)
Pumped hydro (Utility, -1±8%) Lead-acid (Multiple, 4±6%) Lead-acid (Residential, 13±5%) Lithium-ion (Electronics, 30±3%) Lithium-ion (EV, 16±4%) Lithium-ion (Residential, 12±4%) Lithium-ion (Utility, 12±3%) Nickel-metal hydride (HEV, 11±1%) Vanadium redox-flow (Utility, 11±9%) Electrolysis (Utility, 18±6%) Fuel Cells (Residential, 18±2%) System Pack Module Battery
109 87 72 52 51 20 15 14 12 10 100 1.000 Raw Material Cost (US$2015/kWhcap)
13
IPCC Fifth Assessment Report
must reduce to max. 5 GtCO2 by 2050 (glob.)
sectors to completely decarbonize
Source: Climate Change 2014: Synthesis Report. Contribution of Working Groups I, II and III to the Fifth Assessment Report of the Intergovernmental Panel on Climate Change [Core Writing Team, R.K. Pachauri and L.A. Meyer (eds.)], IPCC, Geneva, 2014.); Future Energy Scenarios, National Grid, 2017.
10 20 30 40 50 Baseline 450ppm with CCS 450ppm w/o CCS Annual emissions (GtCO2-eq/year) 0% 5% 10% 15% 20% 25% 2015 2020 2025 2030 2035 2040 2045 2050 Storage vs. Renewable capacity 2015 2016 2017
National Grid – Future Energy Scenarios
emissions by 2050 compared to 1990 levels
5-25% of renewable capacity to succeed
2030 2050 2100
14
Experience Curves Power System Model (UK) 1. Determine experience rates for storage technologies 2. Combine with market forecasts to project future cost of three storage technologies
15y, 6h, 75%AC-AC
1. Model baseline scenario for 80% emission reduction by 2050 2. Model storage scenario for three technologies at 5-30% share of Ren. 3. Determine marginal abatement cost for 80%+ emission reduction with storage