
SLIDE 1
Provider Alliance August 28th
th
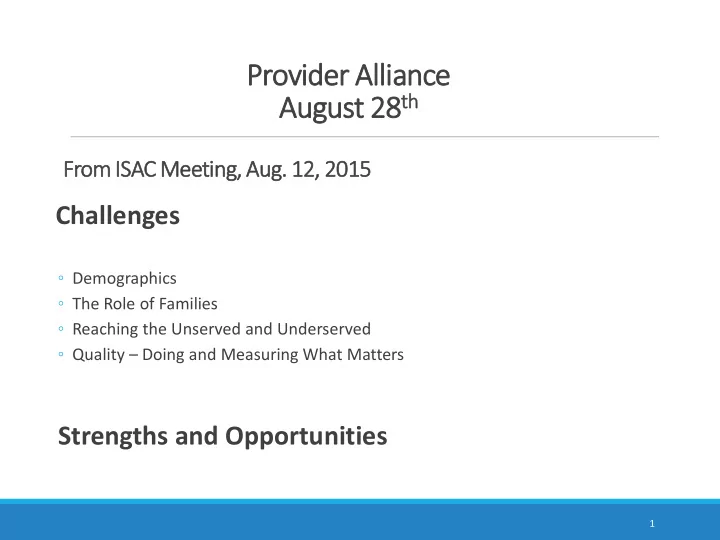
From ISAC Meeting, Aug. 12, 2015
1
Challenges
- Demographics
- The Role of Families
- Reaching the Unserved and Underserved
- Quality – Doing and Measuring What Matters