
SLIDE 1
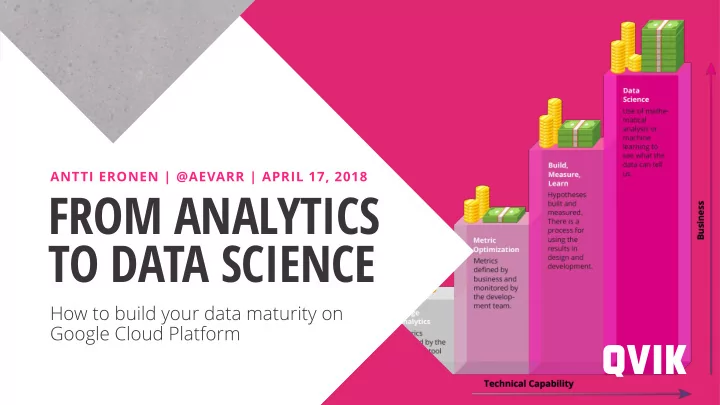
How to build your data maturity on Google Cloud Platform
FROM ANALYTICS TO DATA SCIENCE
ANTTI ERONEN | @AEVARR | APRIL 17, 2018
FROM ANALYTICS TO DATA SCIENCE How to build your data maturity on - - PowerPoint PPT Presentation
ANTTI ERONEN | @AEVARR | APRIL 17, 2018 FROM ANALYTICS TO DATA SCIENCE How to build your data maturity on Google Cloud Platform AGENDA 1 2 3 DATA MATURITY MODEL BUSINESS CASE EXAMPLES ARCHITECTURE Characteristics of each What did we do?
How to build your data maturity on Google Cloud Platform
ANTTI ERONEN | @AEVARR | APRIL 17, 2018
DATA MATURITY MODEL
Characteristics of each level
BUSINESS CASE EXAMPLES
What did we do? Why?
ARCHITECTURE
How was the example case implemented?
@QVIK
@QVIK
downloads (always improving!)
@QVIK
LEVEL 0
brand
BUSINESS QUESTIONS
downloaded list?
@QVIK
LEVEL 0 THIS WAS #1 IN APP STORE!
@QVIK
iOS
LEVEL 0
@QVIK
LEVEL 1
reader numbers
number of users
to improve product/service
@QVIK
LEVEL 1
@QVIK
iOS / Android / Web
LEVEL 1
Google Analytics
to see impact of their actions
BUSINESS QUESTIONS
@QVIK
LEVEL 2
@QVIK
LEVEL 2
Analytics Firebase iOS / Android Analytics events BigQuery Calculated daily results BigQuery Daily queries with cron Compute Engine Team dashboard Data Studio Report & Share
Tableau
@QVIK
we need to have raw data available.
@QVIK
LEVEL 3
hypotheses in development process are tested with real data
BUSINESS QUESTIONS
behaviour when users are not logged in?
@QVIK
LEVEL 3
@QVIK
Analytics Firebase iOS / Android Analytics events BigQuery Calculated daily results BigQuery Daily queries with cron Compute Engine Team dashboard Data Studio Report & Share
Tableau
LEVEL 3
@QVIK
Analytics Firebase iOS / Android Analytics events BigQuery Calculated daily results BigQuery Daily queries with cron Compute Engine Report & Share
3rd party tools
LEVEL 3
Web Google Analytics 3rd party ad framework pixel.gif Cloud Storage Access logs Cloud Storage Notify new logs Pub/Sub Parse logs Dataflow User ID’s BigQuery
@QVIK
LEVEL 4
to also see what data can tell us without seeking answers to pre-defined questions
(mobile apps, web users, visits to physical stores, CRM, ERP, etc.)
enable interesting observations on a single user level
@QVIK
LEVEL 4
predict near future
improve prediction
BUSINESS QUESTIONS
week?
@QVIK
Analytics Firebase iOS / Android Analytics events BigQuery Calculated daily results BigQuery Daily queries with cron Compute Engine Report & Share
3rd party tools
Web Google Analytics 3rd party ad framework pixel.gif Cloud Storage Access logs Cloud Storage Notify new logs Pub/Sub Parse logs Dataflow User ID’s BigQuery
LEVEL 4
@QVIK
Calculated daily results BigQuery fy new logs /Sub rse logs Dataflow
LEVEL 4
Analysis Datalab Prediction model Cloud ML
@QVIK
JARI LINDHOLM
Head of Cloud Business
ANTTI ERONEN
Business Designer
JERRY JALAVA
Senior System Architect, Google Developer Expert
@QVIK
PIA HÖGLUND
Digitalisation Consultant