SLIDE 1
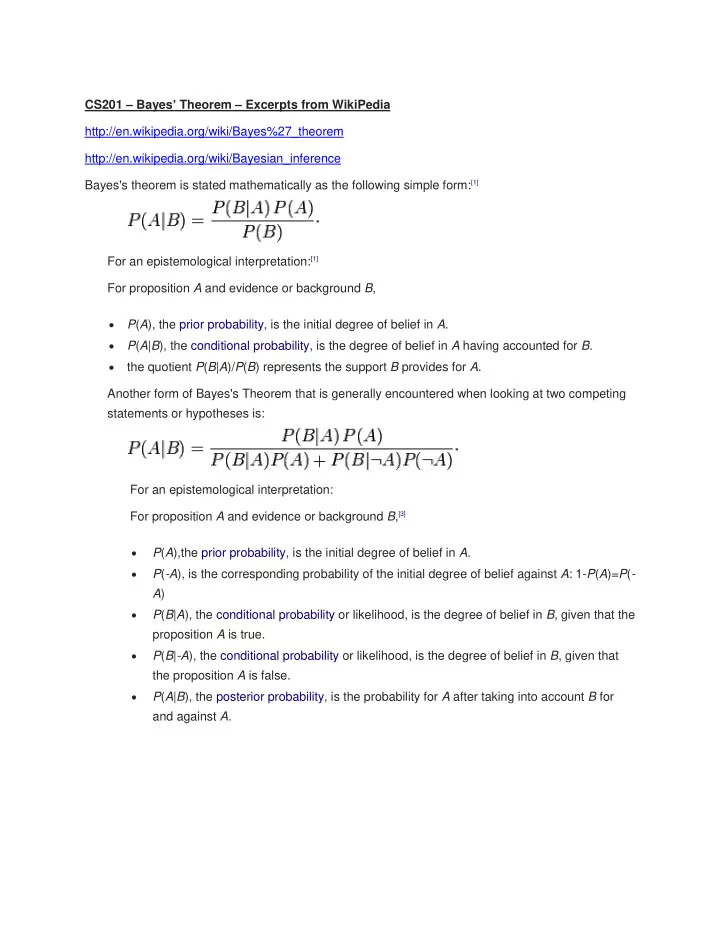
CS201 – Bayes’ Theorem – Excerpts from WikiPedia http://en.wikipedia.org/wiki/Bayes%27_theorem http://en.wikipedia.org/wiki/Bayesian_inference Bayes's theorem is stated mathematically as the following simple form:[1] For an epistemological interpretation:[1] For proposition A and evidence or background B,
P(A), the prior probability, is the initial degree of belief in A. P(A|B), the conditional probability, is the degree of belief in A having accounted for B. the quotient P(B|A)/P(B) represents the support B provides for A.
Another form of Bayes's Theorem that is generally encountered when looking at two competing statements or hypotheses is: For an epistemological interpretation: For proposition A and evidence or background B,[3]
P(A),the prior probability, is the initial degree of belief in A.
P(-A), is the corresponding probability of the initial degree of belief against A: 1-P(A)=P(- A)
P(B|A), the conditional probability or likelihood, is the degree of belief in B, given that the proposition A is true.
P(B|-A), the conditional probability or likelihood, is the degree of belief in B, given that the proposition A is false.
P(A|B), the posterior probability, is the probability for A after taking into account B for and against A.
SLIDE 2
Frequentist example
An entomologist spots what might be a rare subspecies of beetle, due to the pattern on its back. In the rare subspecies, 98% have the pattern, or P(Pattern|Rare) = 98%. In the common subspecies, 5% have the pattern. The rare subspecies accounts for only 0.1% of the population. How likely is the beetle having the pattern to be rare, or what is P(Rare|Pattern)? From the extended form of Bayes's theorem (since any beetle can be only rare or common),
Tree diagram illustrating frequentist example. R, C, P and P bar are the events representing rare, common, pattern and no pattern. Percentages in parentheses are calculated. Note that three independent values are given, so it is possible to calculate the inverse tree (see figure above).
SLIDE 3 Coin flip example
"Assume that you are presented with three coins, two of them fair and the other a counterfeit that always lands heads. If you randomly pick one of the three coins, the probability that it's the counterfeit is 1 in 3. This is the prior probability of the hypothesis that the coin is counterfeit. Now after picking the coin, you flip it three times and observe that it lands heads each time. Seeing this new evidence that your chosen coin has landed heads three times in a row, you want to know the revised posterior probability that it is the counterfeit. The answer to this question, found using Bayes's theorem (calculation mercifully omitted), is 4 in 5. You thus revise your probability estimate
- f the coin's being counterfeit upward from 1 in 3 to 4 in 5."
The calculation ("mercifully supplied") follows:
SLIDE 4 Drug testing
Suppose a drug test is 99% sensitive and 99% specific. That is, the test will produce 99% true positive results for drug users and 99% true negative results for non-drug users. Suppose that 0.5%
- f people are users of the drug. If a randomly selected individual tests positive, what is
the probability he or she is a user? Despite the apparent accuracy of the test, if an individual tests positive, it is more likely that they do not use the drug than that they do. This surprising result arises because the number of non-users is very large compared to the number of users; thus the number of false positives (0.995%) outweighs the number of true positives (0.495%). To use concrete numbers, if 1000 individuals are tested, there are expected to be 995 non-users and 5 users. From the 995 non-users, 0.01 × 995 ≃ 10 false positives are
- expected. From the 5 users, 0.99 × 5 ≃ 5 true positives are expected. Out of 15 positive results,
- nly 5, about 33%, are genuine.
Note: The importance of specificity can be illustrated by showing that even if sensitivity is 100% and specificity is at 99% the probability of the person being a drug user is ≈33% but if the specificity is changed to 99.5% and the sensitivity is dropped down to 99% the probability of the person being a drug user rises to 49.8%. Even at 99% sensitivity and 99% specificity the probability of a person being a drug user is 47.5%.
Tree diagram illustrating drug testing example. U, U bar, "+" and "−" are the events representing user, non-user, positive result and negative result. Percentages in parentheses are calculated.
SLIDE 5
Additional Examples:
https://brilliant.org/discussions/thread/conditional-probability-bayes-theorem/ http://chemicalstatistician.wordpress.com/2013/10/30/detecting-an-unfair-die-with-bayes- theorem/
XKCD: http://xkcd.com/1132/
http://www.explainxkcd.com/wiki/index.php/1132:_Frequentists_vs._Bayesians