
SLIDE 1
FragPred V2.0
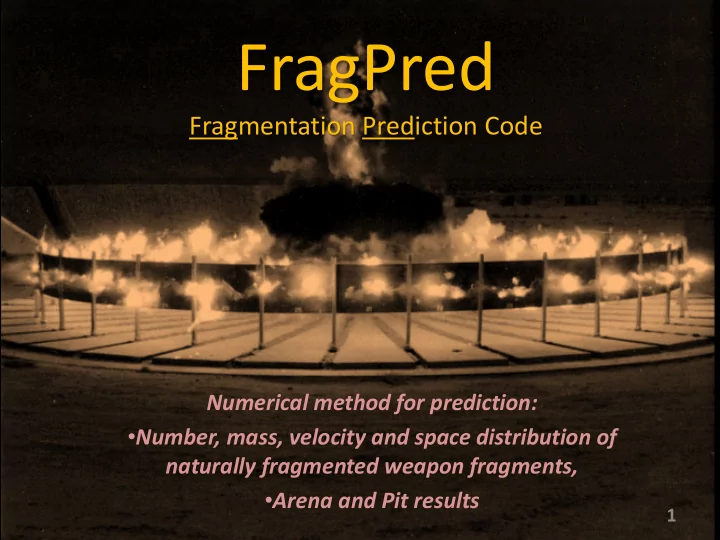
FragPred
Fragmentation Prediction Code
Numerical method for prediction:
- Number, mass, velocity and space distribution of
naturally fragmented weapon fragments,
- Arena and Pit results
1