
SLIDE 1
Fluorescence Microscopy
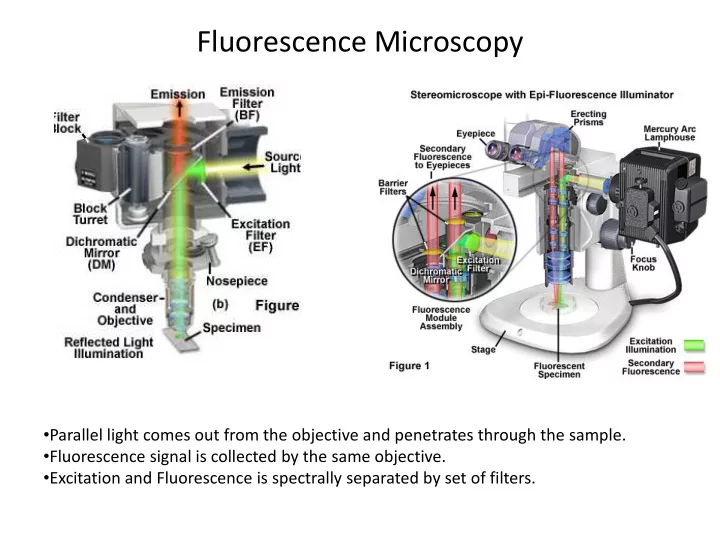
- Parallel light comes out from the objective and penetrates through the sample.
- Fluorescence signal is collected by the same objective.
- Excitation and Fluorescence is spectrally separated by set of filters.