
SLIDE 1
Workshop on Social Simulation of Fisheries and Coastal Management June 6‐7 2016 1
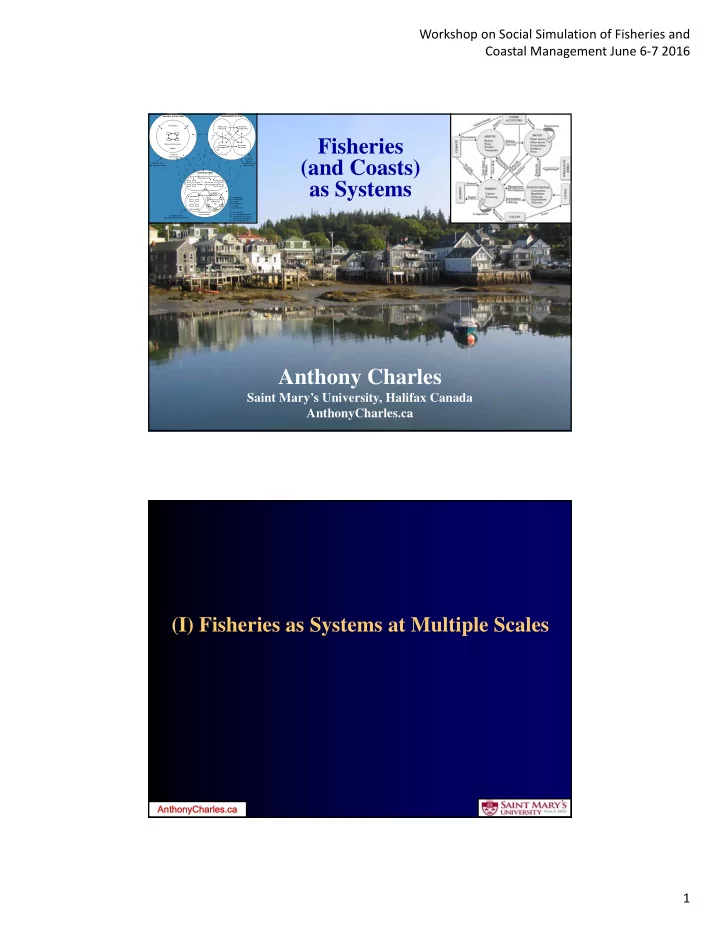
Fisheries (and Coasts) as Systems Anthony Charles
Saint Mary’s University, Halifax Canada AnthonyCharles.ca
External Environment Policy and Planning Resource Management Resource Development Resource Research NATURAL ECOSYSTEM Community MANAGEMENT SYSTEM HUMAN SYSTEM User Groups Resource Technology Resource Users Community Households Processing & Marketing (4) Socioeconomic Environment External Forces (eg. government downsizing) External Forces (eg. macroeconomic policies) External Forces (eg. climate change) (1) User conflicts (2) Technological conflicts (3) Community economics and social interactions (4) Marketing channels P = processing D = distribution M = market W = wholesale R = retail C = consumers Relevant Resources Habitat 1 2 3 P D M W R C(I) Fisheries as Systems at Multiple Scales
AnthonyCharles.ca