financial disclosures financial disclosures
play

Financial Disclosures Financial Disclosures Advisory Board: - PowerPoint PPT Presentation

July 2017 CME (25 minutes) 7/12/2018 Financial Disclosures Financial Disclosures Advisory Board: Epidemiology and Amgen Consequences of Fractures Research Support: Hologic Ann V. Schwartz, PhD Department of Epidemiology and


  1. July 2017 CME (25 minutes) 7/12/2018 Financial Disclosures Financial Disclosures • Advisory Board: Epidemiology and – Amgen Consequences of Fractures • Research Support: – Hologic Ann V. Schwartz, PhD Department of Epidemiology and Biostatistics UCSF Osteoporotic fractures: Outline Outline Incidence rate compared with others • Fracture incidence Hospitalizations • Demographic determinants of fracture incidence – Age – Gender – Race – Geography • Consequences of fracture • Treatment trends • Projected increases in fracture
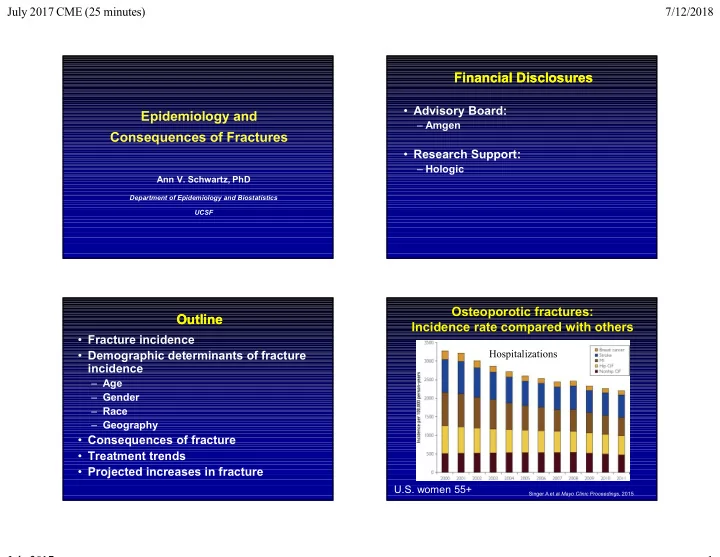
 U.S. women 55+ Singer A et al Mayo Clinic Proceedings , 2015 July 2017 1

  2. July 2017 CME (25 minutes) 7/12/2018 Incidence and Economic Burden of Osteoporosis ‐ Related Fractures in the United States, 2005–2025 Fracture incidence rates by gender and age Common sites of fracture in older adults Common sites of fracture in older adults Incident fracture distribution by type, 2005, U.S. ≥50 Burge et al JBMR 2007 Harvey N et al ASBMR Primer Ch 40 2013 Number of incident fractures, women Number of incident fractures, women Number of incident fractures, men Number of incident fractures, men 500 Hip Vertebral Wrist All 500 Number of Fractures (x1000) Hip Vertebral Wrist All 400 400 Number of Fractures (x1000) 300 300 200 200 100 100 0 0 65-74 50-64 75-84 >85 AGE 50-64 65-74 75-84 >85 AGE Burge et al JBMR 2007 U.S., 2005 U.S., 2005 Burge et al JBMR 2007 July 2017 2

  3. July 2017 CME (25 minutes) 7/12/2018 Lifetime risks of clinical fractures Lifetime risks of clinical fractures Prevalence of Osteoporosis in US Prevalence of Osteoporosis in US 50 year old white women (U.S.) 50 year old white women (U.S.) Postmenopausal Women Men 80 80 Lifetime risk* 70 70 • Hip fracture 17% 60 60 50 50+ 50 50+ • Wrist fracture 16% 30% 16% 40 40 • Vertebral fracture 16% 30 30 • Any fracture > 50% 20 20 10 10 Breast cancer 15% 0 0 50-59 60-69 70-79 80+ 50-59 60-69 70-79 80+ 2005-08 NHANES Osteoporosis: BMD T-score <-2.5 OR qualifying low trauma fx OR FRAX score >3% for hip fx or *Refs: Melton; Black; Kanis Wright et al Osteo Int 2017 >20% for MOF Age and gender are important determinants Major determinants of fracture Major determinants of fracture of fracture incidence incidence incidence Demographic: Age Gender Race Geography Previous fracture: discuss under Consequences of Fracture More on risk factors for fracture and fracture prediction: Talk by Dr. Harris coming up next. Harvey N et al ASBMR Primer Ch 40 2013 July 2017 3

  4. July 2017 CME (25 minutes) 7/12/2018 Lifetime risks of fracture: Lifetime risks of fracture: Age is Independent of BMD as Risk Factor for Age is Independent of BMD as Risk Factor for Hip Fracture Hip Fracture Impact of gender Impact of gender Age (yrs) Lifetime Risk at Age 50* 20 80 Fracture Men (%) Women (%)  5-fold increase in fracture Hip 6 17 70 probability from Wrist 3 16 age 50 to 80 at 10 Clinical Vert Fx 5 16 same BMD 60 Any 16% > 50% 50 0 -3 -2 -1 0 1 * Among Caucasians Hip BMD T-score (SD) Kanis et al, 2004 Hip fracture incidence by race Hip fracture incidence by race Osteoporosis in Men Osteoporosis in Men (California) (California) • 1 in 5 to 6 men over age 50 will suffer osteoporotic fracture • 30% of hip fractures worldwide are in men • Mortality rates after fracture higher in men than women • Treatment rates following fracture are abysmal Sullivan et al 2016 July 2017 4

  5. July 2017 CME (25 minutes) 7/12/2018 Vertebral Fracture Incidence Vertebral Fracture Incidence Hip fracture rates vary dramatically by region and country Worldwide Worldwide Radiographic fractures. Age standardized. Cauley et al. (2014) Nat. Rev. Endocrinol. Ballane et al Osteo Intl 2017 Hip fractures are associated with increased morbidity and mortality Consequences of fracture Consequences of fracture No longer able to live independently No longer able 50% to walk independently No longer able to 40% get in/out of bath 30% 17% Death within Among those independent prefracture one year Magaziner J. J. Gerontol A Biol Sci Med Sci 2000 July 2017 5

  6. July 2017 CME (25 minutes) 7/12/2018 Mortality elevated after hip fracture Mortality elevated after hip fracture Limited Activity Days Post Fracture: Postmenopausal Women in FIT Consequences of fracture Consequences of fracture Women Men Haentjens et al JAMA 2010 Fink et al. Osteo Intl 2003 High medical costs for hip and for other Impact of Vertebral Impact of Vertebral fractures Fractures Fractures Hip $25,519 • 20% excess mortality in 5 yrs Excess direct costs for Medicare patients with nonvertebral fractures after fracture • Deformity & height loss • Acute & chronic pain • Pulmonary dysfunction • Diminished quality of life: loss of self-esteem, sleep disorder, depression, loss of independence Costs for year after fracture (1999-2006) Pike et al PharmacoEconomics 2012 Expressed in 2006 dollars July 2017 6

  7. July 2017 CME (25 minutes) 7/12/2018 Length of stay and hospitalization costs for Consequence of fracture: Consequence of fracture: fractures and other events Increased risk of another fracture Increased risk of another fracture • History of any fracture: 1.5-3.0 fold greater risk of fracture True for • any fracture type • even traumatic fractures • especially strong for men • Mostly independent of BMD vanStaa, Osteop Int 2002;13:624-9 Meta-analysis: Klotzbuecher, JBMR 2000;15:721; Kanis Osteop Int 2004 Singer et al Mayo Clinic Proceedings 2015, Vertebral fractures dramatically Vertebral fractures dramatically Existing Vertebral Fracture Predictive of Existing Vertebral Fracture Predictive of increase risk of future fracture increase risk of future fracture Future Vertebral Fracture Independent of BMD Future Vertebral Fracture Independent of BMD • 4x risk of more vert fxs 5.8 • 2x risk of other fractures Previous 3.4 ( vanStaa, Osteop Int 2002 ) Vert Frx Low BMD 2.3 Mid BMD • Women with clinical High BMD 1.7 diagnosis of vertebral No Vert Frx 1.0 fracture have 5-15% 5 yr 0.2 hip fracture risk! 0 1 2 3 4 5 6 Not in FRAX Risk of New Vertebral Fractures (% / yr) Ross 1991 July 2017 7

  8. July 2017 CME (25 minutes) 7/12/2018 Effect of prevalent radiographic vertebral Effect of prevalent radiographic vertebral fracture on non-vertebral fracture risk fracture on non-vertebral fracture risk No vert fx Trends in Use of Osteoporosis Trends in Use of Osteoporosis Absolute fracture risk (%) >1 vert fx 6 Therapy Therapy 5 4 3 2 1 0 -2 -3 -4 Femoral neck T-score Siris et al, Osteo Int 2007 NYT (6/2/16): Osteoporosis drugs NYT (6/2/16): Osteoporosis drugs Osteoporosis medication use to Osteoporosis medication use to shunned for fear of rare side effects shunned for fear of rare side effects 2004 2004 Brauer et al JAMA 2009 July 2017 8

  9. July 2017 CME (25 minutes) 7/12/2018 Oral Bisphosphonate Use in the U.S. Oral Bisphosphonate Use in the U.S. U.S. Google search activity for “Fosamax” U.S. Google search activity for “Fosamax” Declines after 2008 Declines after 2008 A = Lawsuit filed against Merck for Fosamax causing osteonecrosis of the jaw. B = Study published associating Fosamax with atrial fibrillation. C = Jury deliberations start for first Fosamax trial. D = ABC World News runs feature segment on Fosamax and atypical femoral fractures. % of 55+ y.o. with ≥1 prescription in annual federal survey Jha et al JBMR 2015 Jha et al JBMR 2015 Impact of FDA safety announcements Osteoporosis Medication Use After Hip Fracture Osteoporosis Medication Use After Hip Fracture on use of osteoporosis medications 5/05 3/10 ONJ AFF 10/07 A fib U.S., 50+, 2002-11 Solomon et al JBMR 2014 Kim et al JBMR 2015 July 2017 9

  10. July 2017 CME (25 minutes) 7/12/2018 Osteoporosis ‐ Related Health Services Utilization After Osteoporosis ‐ Related Health Services Utilization After Osteoporosis Therapy after Fracture Osteoporosis Therapy after Fracture First Hip Fracture First Hip Fracture (Medicare, 2008-13) (Medicare, 2008-13) Women in the United States, 2008–2014 Women in the United States, 2008–2014 Within 1 yr Gillespie & Morin JBMR 2017 Weaver…Harris et al J Manag Care Spec Pharm. 2017 Prospects for the Future… Prospects for the Future… Osteoporosis Therapy after Fracture, by Sex Osteoporosis Therapy after Fracture, by Sex Hip fracture incidence declining in U.S. Hip fracture incidence declining in U.S. (Medicare, 2008-13) (Medicare, 2008-13) Within 1 yr Weaver…Harris et al J Manag Care Spec Pharm. 2017 Jha et al JBMR 2015 July 2017 10

  11. July 2017 CME (25 minutes) 7/12/2018 Hip Fracture Rates Declining in West, Hip Fracture Rates Declining in West, Including California Including California Increasing in East Increasing in East Hip fracture incidence in CA Sullivan et al 2016 Ballane et al JBMR 2014 Age-standardized World Population: 1990 and 2025 World Population: 1990 and 2025 Prospects for the Future ... Prospects for the Future ... Age range (years) 80+ 1990 71-75 Men Women • Elderly represent fastest growing segment of population 61-65 51-55 • Thus, in spite of declining rates in US, total number of 41-45 fractures expected to increase 31-35 21-25 11-15 0-5 80+ 2025 71-75 61-65 51-55 41-45 31-35 21-25 11-15 0-5 300 200 100 0 100 200 300 Number (000,000) July 2017 11

Download Presentation
Download Policy: The content available on the website is offered to you 'AS IS' for your personal information and use only. It cannot be commercialized, licensed, or distributed on other websites without prior consent from the author. To download a presentation, simply click this link. If you encounter any difficulties during the download process, it's possible that the publisher has removed the file from their server.

Recommend


More recommend