Hydraulic fracturing Peter Fokker Gnter Zimmermann Torsten - - PowerPoint PPT Presentation

hydraulic fracturing
SMART_READER_LITE
LIVE PREVIEW

Hydraulic fracturing Peter Fokker Gnter Zimmermann Torsten - - PowerPoint PPT Presentation

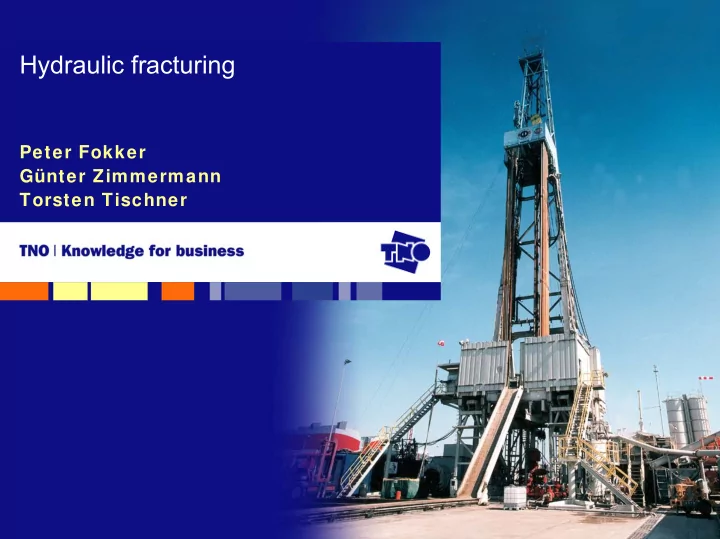
Hydraulic fracturing Peter Fokker Gnter Zimmermann Torsten Tischner Outline Introduction Hydraulic fracturing Types of applications in the oil industry Considerations of design and monitoring Applications in Geothermal


slide-1
SLIDE 1

Hydraulic fracturing

Peter Fokker Günter Zimmermann Torsten Tischner

slide-2
SLIDE 2

Outline

  • Introduction
  • Hydraulic fracturing
  • Types of applications in the oil industry
  • Considerations of design and monitoring
  • Applications in Geothermal Energy
  • Concluding remarks
slide-3
SLIDE 3

Introduction

Stimulation of under-performing wells

  • Matrix acidizing
  • Dissolve “skin” with acid (HCl, HF)
  • Not working with all kinds of damage
  • Concern of tubing corrosion
  • Hydraulic fracturing
  • Increase inflow area
  • Improve connection between well and reservoir
  • Pump fluid with high pressure – break the formation
  • Pump “proppant” in open fracture
  • Keep frac open after shutin
  • High-permeability path from reservoir to well
slide-4
SLIDE 4

Hydraulic fracturing – Basic concepts

  • Stress: maximum stress vertical;

minimum and medium stresses horizontal

  • Modes of fracturing
  • Hydraulic fracturing: Tensile (mode I) – Vertical fracture has least

resistance

σ1 σ3 σ2

Mode I: Opening Mode III: Tearing Mode II: Sliding

slide-5
SLIDE 5

Hydraulic fracturing – Visualization of the process

  • Processes in hydraulic fracturing

Wellbore Elastic opening Pressure support

  • f fracture walls

Friction

Leakoff Fracture Propagation Rock Strength Stress Intensity Factor Injection

slide-6
SLIDE 6

Hydraulic fracturing – Concept

( )

( )

∫ ∫

= ⋅ − = = − = = =

t leakoff penetrated penetrated res frac leakoff fracture leakoff leakoff leakoff inj fracture fracture I

dt v d d p p v dA v Q Q Q dt dV A V w A w f K ' ,

  • KI: Stress intensity – measure
  • f singular stress behaviour

beyond the tip

  • Length increases when KI > KIc
  • Volume balance
  • Leakoff correlation
slide-7
SLIDE 7

Hydraulic fracturing – Complicating issues

  • Profile of the minimum in-situ stress
  • Elasticity profile
  • Influence of pore pressure increase and temperature decrease
  • n stress (poro-elasticity and thermo-elasticity)
  • 3D pore pressure field complicates leakoff correlation
  • Plugging of the fracture interior
slide-8
SLIDE 8

Layered Reservoir

  • Stress Profile
  • Elasticity Profile
  • Permeability Profile
  • Porosity Profile

depth σ3 injection log k

slide-9
SLIDE 9

depth injection σ3 log k Fracture vs time

slide-10
SLIDE 10

Hydraulic fracturing – Types of applications 1 Massive hydraulic fracturing

  • Large treatments
  • Low-permeability reservoir
  • Create additional contact area
  • Multiple fractures in a horizontal well
slide-11
SLIDE 11

Hydraulic fracturing – Types of applications 2 Tip-Screen-Out fracturing / Frac & Pack

  • Goal: Bypass damage
  • Typically in higher-permeability reservoir
  • Short fracture
  • Tip-Screen-Out to increase fracture width
slide-12
SLIDE 12

Hydraulic fracturing – Types of applications 3 Water injection under fracturing conditions

Cracking Fluid flow in Reservoir

Fluid flow in Fracture

Plugging and Channelling in Fracture

Reduced Permeability Fracture

slide-13
SLIDE 13

Hydraulic fracturing – Types of applications 4 Water Fracturing

Barnett shale

  • Very low permeability
  • Naturally fractured
  • Goal: interconnected

fracture network

  • Waterfracturing
  • Monitoring
slide-14
SLIDE 14

Design considerations

The goal of hydraulic fracturing is economic

  • Expected production
  • Connection with Geology (Flow barriers, Permeability,

Heterogeneity, Natural fractures) Key design parameter: Dimensionless fracture conductivity Optimum value:

  • High k: maximize width and proppant permeability
  • Low k: maximize length

L k w k C

f fD

⋅ ⋅ =

slide-15
SLIDE 15

Design considerations

More input for design:

  • In-situ stresses
  • Fracturing pressures Minifrac test
  • Leakoff behaviour
  • Effects of layering:
  • Containing capacity
  • Connection
  • Natural fractures
  • Poro-elasticity
  • Thermo-elasticity

}

slide-16
SLIDE 16

Monitoring

Build up a knowledge base:

  • Treatment performance
  • Productivity monitoring

Treatment performance monitoring

  • Rates & Pressure traces

(e.g. Tip-Screen-Out)

slide-17
SLIDE 17

Monitoring

Build up a knowledge base:

  • Treatment performance
  • Productivity monitoring

Treatment performance monitoring

  • Rates & Pressure traces

(e.g. Tip-Screen-Out)

  • Use fracture simulator
slide-18
SLIDE 18

Monitoring

Build up a knowledge base:

  • Treatment performance
  • Productivity monitoring

Treatment performance monitoring

  • Rates & Pressure traces

(e.g. Tip-Screen-Out)

  • Use fracture simulator
  • Tiltmeters
  • Surface
  • Offset well
slide-19
SLIDE 19

Monitoring

Build up a knowledge base:

  • Treatment performance
  • Productivity monitoring

Treatment performance monitoring

  • Rates & Pressure traces

(e.g. Tip-Screen-Out)

  • Use fracture simulator
  • Tiltmeters
  • Surface
  • Offset well
  • Microseismic mapping

two downhole receivers

slide-20
SLIDE 20

A little more on micro-seismic mapping

  • Principle: micro “earthquakes” induced by σ & p changes and

slippage along weak planes

  • Measure orientation and distance from s and p waves
slide-21
SLIDE 21
slide-22
SLIDE 22
slide-23
SLIDE 23
slide-24
SLIDE 24
slide-25
SLIDE 25

Monitoring

Build up a knowledge base:

  • Treatment performance
  • Productivity monitoring

Productivity monitoring

  • Well testing:

Effective fracture size

slide-26
SLIDE 26

Monitoring

Build up a knowledge base:

  • Treatment performance
  • Productivity monitoring

Productivity monitoring

  • Well testing:

Effective fracture size

  • Productivity evaluation

e.g. Stimulated Volume Analysis

slide-27
SLIDE 27

Example: Gross Schönebeck

  • Permeability 10 – 150 md → regular hydraulic fracture: Feb 2002
  • Viscous fracturing fluid
  • Proppant
  • Disappointing result: Productivity increase by factor 1.8

(expected 6 – 8)

  • Possible causes
  • Proppant impairment
  • Fracture face skin
  • Insufficient fluid

cleanup

  • Post-frac monitoring

(injection test) might indicate effective fracture length

slide-28
SLIDE 28
slide-29
SLIDE 29
slide-30
SLIDE 30
slide-31
SLIDE 31

Results and conclusions from Gross Schönebeck

  • Propped fracture in sand: Productivity Improvement Factor 1.8
  • No self-propping
  • Not enough proppant layers
  • Closure of fractures at low differential pressures
  • 2 massive waterfrac treatments:

productivity improvement factors of 4 and 8

  • Only in volcanic rocks
  • Closure of sandstone layers at low differential pressure
  • Recommendations
  • Separate treatments in different layers:

propped frac in sands, waterfracs in volcanics

  • Post-fracture analysis of injection tests
slide-32
SLIDE 32

Water fracturing in the Genesys project

  • Large amounts of water in low-permeability sandstone
  • Fracture growth out-of-zone into clay
  • Fracture self-propping
  • Very few micro-seismic events
  • Productivity not large enough
  • Cyclic injection – production promising
slide-33
SLIDE 33

Location and Geology

  • Centre of N German

Basin

  • Target: Middle Bunter

(3630 m ; 158°C; 6 – 20 m thickness)

  • φ = 3 – 11%
  • k ≤ 1 md
  • Re-injection in

Kalkarenit (1150 – 1250 m)

  • Medium & minimum

stress comparable

slide-34
SLIDE 34

Fracturing and test program

  • Four waterfrac tests in 6-m sandstone
  • Total 20,000 m3 water injected
  • Later injection increased fracture pressure
  • “Venting tests”
  • No decrease in fracture conductivity
  • High temperatures
  • Possibility of cyclic injection & production??
  • Injection at 10°C
  • Production at 80°C (daily cycle) / 110°C (weekly cycle)
slide-35
SLIDE 35

Further testing

  • Fracture storage capacity indicates fracture area: 500,000 m2
  • Pressure decline curves: fracture area 20,000 m2 – area in active

zones Fracture length = 20,000 / 6 = 3.3 km ??

  • Temperature logging: fracture height 150 m

Fracture length = 500,000 / 150 = 3.3 km ??

  • Hardly any microseismic events at surface; No tilt at surface
slide-36
SLIDE 36

Results and conclusions from Genesys test

  • Large fractures created with water fracturing
  • Large fracture conductivity
  • Well productivity too low, but cyclic scheme promising
  • How do the fractures look like?
  • Single long fracture
  • Fracture network
slide-37
SLIDE 37

Concluding remarks

  • Monitoring

Build up a knowledge base

  • Rates
  • Pressures
  • Tiltmeter mapping
  • Microseismics
  • Productivity
  • Application in Geothermal

Energy

  • Gross Schönebeck
  • Genesys
  • What is the goal?
  • Contact area
  • Bypass damage
  • Connect to natural fractures
  • Design
  • Reservoir Permeability
  • Fracture conductivity
  • Geology
  • Rock mechanics
  • Minifrac tests
  • Design software