Disclosures No financial disclosures Quantitative Evaluation of - - PowerPoint PPT Presentation

disclosures
SMART_READER_LITE
LIVE PREVIEW

Disclosures No financial disclosures Quantitative Evaluation of - - PowerPoint PPT Presentation

5/10/2013 Disclosures No financial disclosures Quantitative Evaluation of Fatty Infiltration of the Rotator Cuff Muscles with IDEAL Magnetic Resonance Imaging Drew Lansdown, MD Lorenzo Nardo, MD Dmitrios Karampinos, PhD Julio


slide-1
SLIDE 1

5/10/2013 1

Drew Lansdown, MD Lorenzo Nardo, MD Dmitrios Karampinos, PhD Julio Carballido-Gamio, PhD Thomas Link, MD Benjamin Ma, MD Roland Krug, PhD

Quantitative Evaluation of Fatty Infiltration of the Rotator Cuff Muscles with IDEAL Magnetic Resonance Imaging

Disclosures

  • No financial disclosures

Background

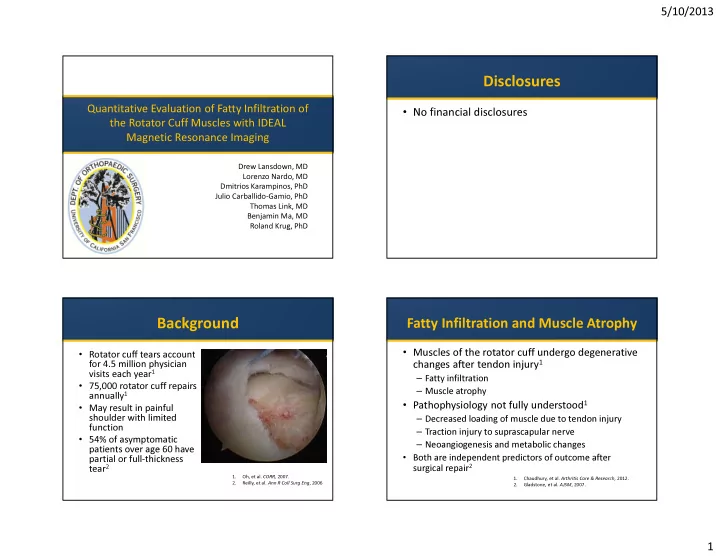
  • Rotator cuff tears account

for 4.5 million physician visits each year1

  • 75,000 rotator cuff repairs

annually1

  • May result in painful

shoulder with limited function

  • 54% of asymptomatic

patients over age 60 have partial or full-thickness tear2

1. Oh, et al. CORR, 2007. 2. Reilly, et al. Ann R Coll Surg Eng, 2006

Fatty Infiltration and Muscle Atrophy

  • Muscles of the rotator cuff undergo degenerative

changes after tendon injury1

– Fatty infiltration – Muscle atrophy

  • Pathophysiology not fully understood1

– Decreased loading of muscle due to tendon injury – Traction injury to suprascapular nerve – Neoangiogenesis and metabolic changes

  • Both are independent predictors of outcome after

surgical repair2

1. Chaudhury, et al. Arthritis Care & Research, 2012. 2. Gladstone, et al. AJSM, 2007.

slide-2
SLIDE 2

5/10/2013 2

Goutallier Classification

  • First described for CT and modified for MRI1,2
  • Qualitative assessment
  • Moderate inter-observer reliability (Κ = 0.53)3

Grade 0 Normal Grade 1 Streaks of fat Grade 2 More muscle than fat Grade 3 Equal muscle and fat Grade 4 More fat than muscle

1. Goutallier, et al. CORR, 1994. 2. Fuchs, et al. JSES, 1999. 3. Lippe, et al. Arthroscopy. 2012.

Clinical Relevance of Fatty Infiltration

  • Cuff integrity after repair is directly related to

muscle quality1,2

– Re-tear rate is 50-70% with FI >= grade 2

  • Unclear if these changes are reversible

– Goutallier - Possibly reverses in SS but not in IS – Gladstone – Minimal to no progression with successful repair

1. Goutallier, et al. CORR, 1994. 2. Gladtsone, et al. AJSM, 2007.

IDEAL MRI

  • Iterative decomposition of

water and fat with echo asymmetry and least- squares estimation (IDEAL)

  • Generates accurate

quantitative fat-fraction map

  • Previous animal studies

validated fat content assessment with histologic studies1

  • 1. Hines, et al. Radiology,2010.

Hypothesis

  • IDEAL MRI fat fraction mapping provides a

continuous variable that is closely correlated with the Goutallier classification

  • Fat fraction values are correlated with

strength testing from physical examination

slide-3
SLIDE 3

5/10/2013 3

Study Design

  • 57 patients undergoing

routine shoulder MRI

  • IDEAL sequence added

to clinical study

  • Goutallier grade given

for each rotator cuff muscle for each patient

  • Range of motion and

pain levels (VAS) recorded from retrospective review of

  • utpatient notes

Imaging Sequence Relevant Acquisition Parameters Purpose Sagittal PDW-FSE TR=2513 ms TE = 31 ms, rBW = 62.5 kHz, ETL = 10, NEX = 4 Goutallier classification Sagittal IDEAL- SPGR 6-points, TE=2.1 ms ∆TE=1.0 ms TR=10.8 ms, FA=3° rBW = 62.5 kHz, NEX=1 Fat quantification

Image Segmentation

  • Segmented on sagittal-
  • blique intermediate-

weighted FSE images

  • Scapular “Y” identified

and a total of 4 slices were segmented

  • Fat-fraction values were

calculated from the segmented regions using IDEAL fat fraction maps

Fat Fraction Values Correlate to Goutallier Classification

Goutallier Grade Mean Fat Fraction Value Range 2.1% (1.3%) 0 – 5.59% 1 5.6% (2.3%) 1.1-9.70% 2 8.5% (2.7%) 6.4 – 14.86% 3 16.2% (1.1%) 15.25 – 17.77% 4 24.7% (3.4%) 19.85 – 29.63%

Pearson’s correlation coefficient r = 0.93

IDEAL Values Have Good Intra/Inter-User Reliability

Supra Infra Subscap Teres Minor All muscles Intra- reproducibility Reader #1 0.96 0.84 0.92 0.96 0.92 Intra- reproducibility Reader #2 0.85 0.87 0.82 0.96 0.90 Inter- reproducibility 0.81 0.84 0.81 0.91 0.84

slide-4
SLIDE 4

5/10/2013 4

IDEAL Values Correlate with Clinical Parameters

Muscles Spearman Rank Correlation-IDEAL Spearman Rank Correlation-GC Spearman p-values IDEAL Spearman p-values GC Supraspinatus Pain – VAS 0.128 0.012 0.3557 0.9318 FF Strength 0.206 0.032 0.1382 0.8215 Ab Strength 0.448 0.223

0.0011*

0.1201 Infraspinatus Pain – VAS 0.119 0.087 0.3910 0.5336 ER Strength 0.368 0.370

0.0067* 0.0064*

Subscapularis Pain – VAS 0.313 0.193

0.0214*

0.1625 IR Strength 0.39 0.30

0.0051* 0.0357*

Conclusions

  • Fat fraction values are reproducible (κ = 0.81 –

0.96)and allow for a continuous variable for fat quantification

  • Strength testing in supraspinatus,

infraspinatus and subscapularis are significantly correlated to IDEAL values

  • IDEAL MRI can lead to improved evaluation

and understanding of fatty infiltration

Acknowledgements

  • Benjamin Ma, MD
  • Roland Krug, PhD
  • Lorenzo Nardo, MD
  • Dmitrios Karampinos, PhD
  • Julio Carballido-Gamio, PhD
  • Thomas Link, MD