SLIDE 1
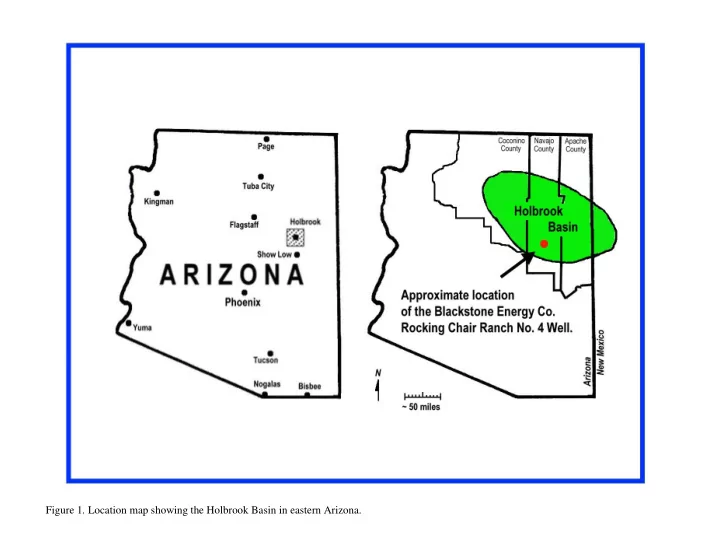
Figure 1. Location map showing the Holbrook Basin in eastern Arizona.
SLIDE 2
Figure 2. Map of northern and central Arizona showing the general location of the Rocking Chair Ranch No. 4 well, Section 27, T.14N, R.19E.
SLIDE 3
Figure 3. Annotated dual induction log of stratigraphic interval of Rocking Chair Ranch No. 4 well (RCR-4).
SLIDE 4
Figure 4. Organic matter content and thermal maturity (raw data).
SLIDE 5
Figure 5. Organic matter content and thermal maturity (data interpreted).
SLIDE 6
Figure 6. Organic matter content and thermal maturity (interpreted data with dual induction log).
SLIDE 7
Figure 7. Correlation of Pennsylvanian and Permian stratigraphic units across northern, eastern, southeastern Arizona and central New Mexico
SLIDE 8
Figure 8. Thermal maturation system developed by Frank L. Staplin (1969).
SLIDE 9
Figure 9. Interpretation of Staplin’s TAI standards by Schwab (1983).
SLIDE 10
Figure 10. Comparison of thermal maturity scales (cross-correlation measurements) made by Schwab (1992).
SLIDE 11
Figure 11. Correlation of TAI, intensity (I), and approximate vitrinite reflectance (%Roe) values.
SLIDE 12
Figure 12. TAI - %Ro well profile of the Supai Formation in the RCR No. 4 well.
SLIDE 13
Figure 13. Thermal maturation of organic matter, as related to changes in the color of the trilete spores, pollen, and tissue fragments (Schwab, 1977).
SLIDE 14
Figure 14. Corduroy Sandstone TAI assemblage, based of study of RCR-4.
SLIDE 15
Figure 15. Corduroy Sandstone palynomorph assemblage, based on study of RCR-4.
SLIDE 16
Figure 16. Domitized calcite-aragonite, lower Corduroy Sandstone.
SLIDE 17
Figure 17. Fort Apache Limestone TIA assemblage, based on study of RCR-4.
SLIDE 18
Figure 18. Fort Apache Limestone palynomorph assemblage, based on study of RCR-4.
SLIDE 19
Figure 19. Big A Butte Member TIA assemblage, based on study of RCR-4.
SLIDE 20
Figure 20. Big A Butte Member palynomorph assemblage, based on study of RCR-4.
SLIDE 21
Figure 21. Most commonly used methods for the characterization of source rocks. Modified from Tissot and Welte (1978).
SLIDE 22
Figure 22. Total organic carbon (TOC %Wt.) profile of the Supai Formation in the RCR No. 4 well.
SLIDE 23
Figure 23. TOC profile of the RCR No. 4 well. Note the rhythmic variations in the TOC content through this portion of the Supai Formation.
SLIDE 24
Figure 24. Striate bisaccate pollen and other palynomorphs from the RCR No. 4 well.
SLIDE 25
Figure 25. The trilete spore Cirratriradites sp.
SLIDE 26
Table 1. Total Organic Carbon (TOC %Wt.) values recorded for the Rocking Chair Ranch No. 4 well.