SLIDE 1
Field Studies of Whales, Dolphins, and Sea Turtles for Offshore - - PowerPoint PPT Presentation
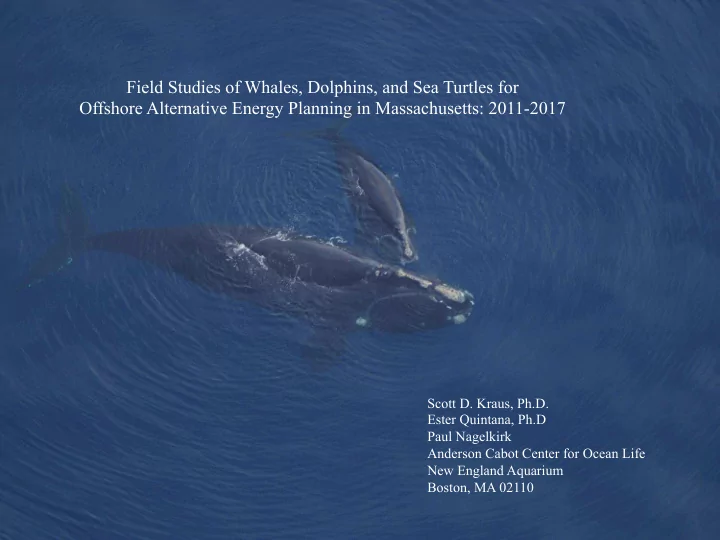
Field Studies of Whales, Dolphins, and Sea Turtles for Offshore Alternative Energy Planning in Massachusetts: 2011-2017 Scott D. Kraus, Ph.D. Ester Quintana, Ph.D Paul Nagelkirk Anderson Cabot Center for Ocean Life New England Aquarium
SLIDE 2
SLIDE 3
SLIDE 4
¡ Probability ¡of ¡detec/on ¡of ¡animals ¡or ¡groups ¡declines ¡with ¡their ¡distance ¡from ¡the ¡transect. ¡In ¡line-‑transect ¡(or ¡distance) ¡ sampling ¡theory, ¡f(0) ¡is ¡the ¡probability ¡density ¡func/on ¡of ¡right-‑angle ¡sigh/ng ¡distances ¡(for ¡that ¡species ¡and ¡pla?orm) ¡ evaluated ¡at ¡a ¡distance ¡of ¡0. ¡The ¡reciprocal ¡of ¡f(0) ¡is ¡the ¡“effec/ve ¡strip ¡width,” ¡a ¡sta/s/cal ¡es/mate ¡of ¡the ¡area ¡effec/vely ¡ searched ¡on ¡either ¡side ¡of ¡the ¡transect. ¡ ¡
Observer ¡Viewfield ¡ 465 ¡1 ¡obscured ¡ Camera ¡Viewfield ¡ 424 ¡1 ¡wide ¡FOV ¡ Effec<ve ¡strip ¡width ¡for ¡large ¡ whales ¡is ¡ca. ¡1.13 ¡nm ¡ Observer ¡nearfield ¡view ¡is ¡
- bscured ¡by ¡fuselage ¡out ¡
to ¡2331 ¡from ¡the ¡ trackline ¡@ ¡1000 ¡1 ¡
Cessna Skymaster O-2 Observer and Camera Viewfields
Observer ¡Viewfield ¡
SLIDE 5
1 14 21 29 9 11 1 1 5 10 15 20 25 30 35 Jan Feb Mar Apr May Jun Jul Aug Sep Oct Nov Dec Number of Sightings Month
Fin ¡whale ¡sigh<ng ¡totals ¡by ¡month, ¡ combined ¡across ¡all ¡survey ¡years ¡ (October ¡2011 ¡– ¡June ¡2015). ¡
1 3 33 17 22 3 2 1 5 10 15 20 25 30 35 Jan Feb Mar Apr May Jun Jul Aug Sep Oct Nov Dec Number of Sightings Month
Humpback ¡whale ¡sigh<ng ¡totals ¡by ¡ month, ¡combined ¡across ¡all ¡survey ¡ years ¡(October ¡2011 ¡– ¡June ¡2015). ¡
3 20 38 13 5 3 1 5 10 15 20 25 30 35 40 Jan Feb Mar Apr May Jun Jul Aug Sep Oct Nov Dec Number of Sightings Month
Minke ¡whale ¡sigh<ng ¡totals ¡by ¡month, ¡ combined ¡across ¡all ¡survey ¡years ¡ (October ¡2011 ¡– ¡June ¡2015). ¡
SLIDE 6
20 40 60 80 100 Jan Feb Mar Apr May Jun Jul Aug Sep Oct Nov Dec Mean Monthly % Presence
7 14 21 14 4 5 10 15 20 25 Jan Feb Mar Apr May Jun Jul Aug Sep Oct Nov Dec Number of Sightings Month
Right ¡whale ¡sigh<ng ¡ totals ¡by ¡month, ¡ combined ¡across ¡all ¡ survey ¡years ¡(October ¡ 2011 ¡– ¡June ¡2015). ¡ Right ¡whale ¡mean ¡ monthly ¡acous<c ¡ presence ¡± ¡standard ¡ error ¡for ¡all ¡years ¡
- combined. ¡
SLIDE 7
SLIDE 8
MA ¡CEC ¡WEA ¡Survey ¡Results ¡ ¡ ¡2017 ¡
SLIDE 9
Feb ¡– ¡Oct. ¡2017 ¡
SLIDE 10
Humpback ¡Whales ¡2017 ¡ ¡ ¡ ¡ ¡ ¡ ¡Finback ¡Whales, ¡2017 ¡ Sei ¡Whales ¡2017 ¡ ¡ ¡ ¡Minke ¡Whales ¡2017 ¡
SLIDE 11
Recommendations 1)The seasonality and spatial distribution of marine mammals in the area suggests seasonal and spatial management of survey and construction activities should be considered for implementation during environmental review and permitting. 2 The long-term impacts of offshore wind farm facilities should be carefully assessed using a statistically robust design to understand the consequences of such development on marine mammal and sea turtle distribution, abundance, behavior, and communications. 3) Focused oceanographic studies are needed to interpret the occurrence of endangered whales in the SA. There are two questions:
- Can offshore wind facilities affect whale habitat or behavior, thereby
changing distribution and/or behavior?
- Are whale distributions food dependent, and any changes in