
SLIDE 1
FHWA/KTMPO LIVABILITY WORKSHOP
March 5, 2018
FHWA/KTMPO LIVABILITY WORKSHOP March 5, 2018 OUTLINE / TALKING - - PowerPoint PPT Presentation
FHWA/KTMPO LIVABILITY WORKSHOP March 5, 2018 OUTLINE / TALKING POINTS Who is The HOP? What is The HOPs role in the Livability Mission? Services Provided and Not Provided by The HOP Performance Measures Can The HOP Improve
March 5, 2018
30 Minutes: Speed through first 5 points & spend remaining time on the few slides
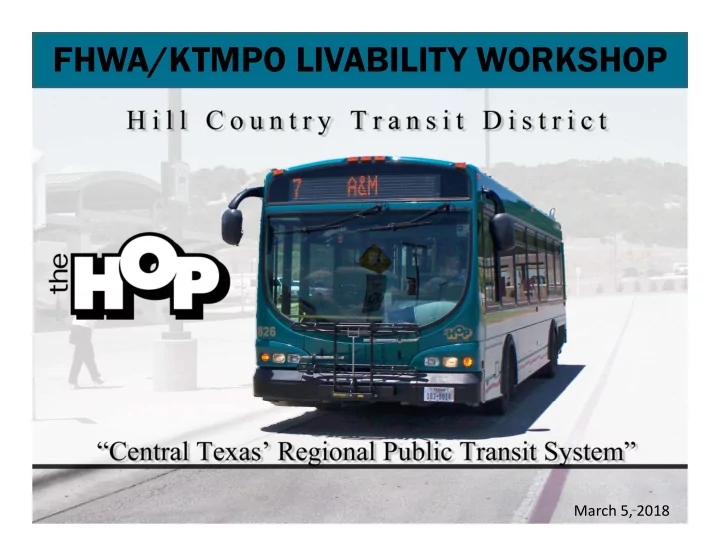
MISSION STATEMENT: Hill Country Transit District, a political subdivision of the State of Texas, is a regional public transit system whose mission is to build, refine, and operate a safe, dependable, and effective transportation network that provides mobility, improves the quality of life, and stimulates economic development through the provision
rural, urban fixed route, and ADA complementary paratransit service for citizens and visitors of the Central Texas area.
Fixed Route Service (FRS) (backbone) Rural Transit Service Special Transit Service (ADA)
10 Urban Fixed Routes 21 FRS Buses 483 Total Fixed Route Bus Stops 194 Passenger Shelters Route Information at Each Stop and Shelter Over 45,907 Passengers per Month (2017 Avg.) (550,884 FRS Passengers Last Year…backbone)
HH Killeen CC Temple Belton
11 Sites in 9 counties (over 9,000 square miles) 64 Rural Vehicles 46 Rural Drivers Over 125,000 Passengers Per Year
Division Calendar Year 2017 Calendar Year 2016 Fixed Route 550,884 606,542 Special Transit 163,355 146,506 Rural 133,531 129,472 Totals 847,770 882,520
year service life
scheduling building
service area (Central Dispatch & Locker Rooms)
Service Reps.
employees
Measure 2017 Performance Goal Fixed Route Ridership 14.0 Passengers/ Service Hour 10.0 Passengers/ Service Hour Paratransit Ridership 2.0 Passengers/ Service Hour 2.0 Passengers/ Service Hour ADA Ride Length 4% of ADA Trips Over an Hour in Length Less than 5% of ADA Trips Over an Hour in Length Missed FRS Trips 0.5% of Trips Missed 2.0% of Trips Missed Customer Complaints 0.05 Complaints/100 Passengers 1.00 Complaints/100 Passengers Safety Performance 1.92 Accidents/100k Miles 4 Accidents/100k Miles Maintenance Road Calls 5.29 Road Calls/100k Miles 10 Road Calls/100k Miles Customer Service Telephones 46 Second Wait Time Wait Times Under Two Minutes Travel Training Twelve Training Programs in 2017 No Fewer Than Twelve Training Programs per Year
Identified through two independent studies 5‐years apart, the most recent in 2016 by Texas A&M, Central Texas
37% 7% 47%
6%
3%
Temple Div. Contribution
Federal 37% State 7% HCTD 47% Local 6% Fare Box 3% 54% 7% 29%
5%
5%
Killeen Div. Contribution
Federal 54% State 7% HCTD 29% Local 5% Fare Box 5%
Funding Sources & Percentages for FY17
All funding sources are maximized
Transit District Metropolitan Transit Authority (MTA)
54 Districts in Texas (17 Urban, 28 Rural, 9 Urban & Rural) 8 MTAs (Austin, Corpus Christi, Dallas, Denton County, El Paso, Ft. Worth, Houston, San Antonio) Size “Criteria” (usually < 200,000) (Trans. Mgmt. Area – FTA) Criteria (always > 200,000) Killeen UZA qualifies Funded via Local General Funds – varies by budget cycle – difficult predictability and sustainability Funded by Dedicated Funding / Tax (Mobility Tax) – specific to movement of people – greatest revenue yield ‐ stable Case Study – Hill Country Transit District Case Study – Corpus Christi Can be organized locally Creation of MTA Requires Voter Referendum HCTD Oversight – elected officials formulate Transit Board Similar Oversight – Transit Board
Disclaimer ‐ Informational purposes only: HCTD has been asked by local and state elected officials to provide information related to methods for funding public transit systems. HCTD does not promote or recommend any specific action or source of transit funding.
DEDICATED FUNDING FOR PUBLIC TRANSIT
Would allow expansion of The HOP service, providing more service in more areas to more people (Livability). Requires solid commitment, local support, patience, and time.
Star Transit City of Hutchins Interlocal Cooperative Agreement
services to Fedex Facility.
public / shared‐ ride concept Bi‐lateral Agreement
services to Fedex Facility.
public / shared ride concept City of Hutchins Fedex Facility Coordinated Public Transit for Fedex Employees and Public