Fatalities by time after crash 35% 31% (0-9 Min.) (90+ Min.) 34% - - PowerPoint PPT Presentation

fatalities by time after crash
SMART_READER_LITE
LIVE PREVIEW

Fatalities by time after crash 35% 31% (0-9 Min.) (90+ Min.) 34% - - PowerPoint PPT Presentation

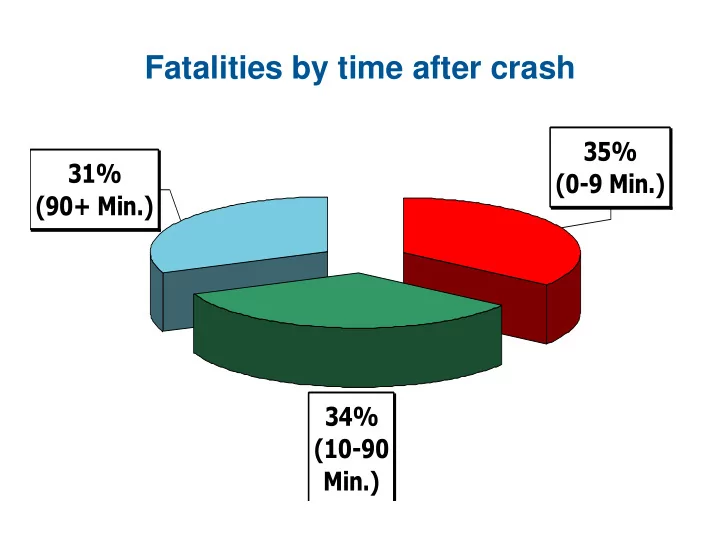
Fatalities by time after crash 35% 31% (0-9 Min.) (90+ Min.) 34% (10-90 Min.) GSM/CDMA GPS Vehicle TSP Call Data Center 5 Voice Public Safety Answering Point Dispatc h Emergency Medical Service, Doctors, Air Rescue, Police,


slide-1
SLIDE 1

31% (90+ Min.) 34% (10-90 Min.) 35% (0-9 Min.)

Fatalities by time after crash

slide-2
SLIDE 2
slide-3
SLIDE 3
slide-4
SLIDE 4
slide-5
SLIDE 5

5

Vehicle

GPS GSM/CDMA

TSP Call Center Data Voice Public Safety Answering Point

Emergency Medical Service, Doctors, Air Rescue, Police, Roadside Assistance

Dispatc h

slide-6
SLIDE 6

As an enhancement to Emergency Services, OnStar will now provide EMD using MPDS protocol

Advisor 1

Bridges Advisor 2 with customer then calls PSAP

Advisor 2 –

EMD

Advisor 1

Able to bridge

  • ccupant, Advisor 2

and PSAP, if PSAP desires

Public Safety Answering Point

slide-7
SLIDE 7

Delta V

  • Principal direction of force (PDOF)
  • Seatbelt usage/or without
  • Crash with multiple impacts
  • Vehicle type
slide-8
SLIDE 8

Target Audience EMS medical directors Public Safety Answering Points (PSAPs) personnel EMS providers Trauma Coordinators Trauma Directors Course Goal Educate participants on: Vehicle telemetry crash data The science behind injury severity prediction algorithms, The integration of AACN into local systems Opportunities for AACN to: Make dispatch more efficient Optimize the use of resources Reduce the morbidity and mortality

slide-9
SLIDE 9
  • Website up:
  • http://www.aacnems.com/
  • Outline Developed
  • Storyboard the content the stakeholders reviewed and approved
  • PowerPoint slides we will be using for the eLearning aspects.
  • Filming short video clips
  • Dispatch
  • Crash
  • Response