
SLIDE 1
Passenger Vehicle Occupant Fatalities by type of crash 4% 2% - - PowerPoint PPT Presentation
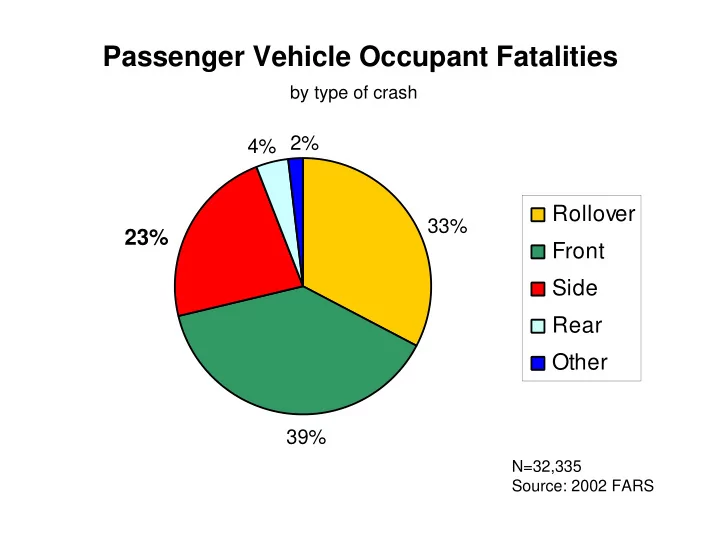
Passenger Vehicle Occupant Fatalities by type of crash 4% 2% Rollover 33% 23% Front Side Rear Other 39% N=32,335 Source: 2002 FARS Side-impact Crashes (non-rollover) by Crash Partner Passenger Cars Other 19% 21% Narrow Objects
Passenger Cars Light Trucks Narrow Objects Heavy Vehicles
(of all side-impact crashes)
Source: NHTSA