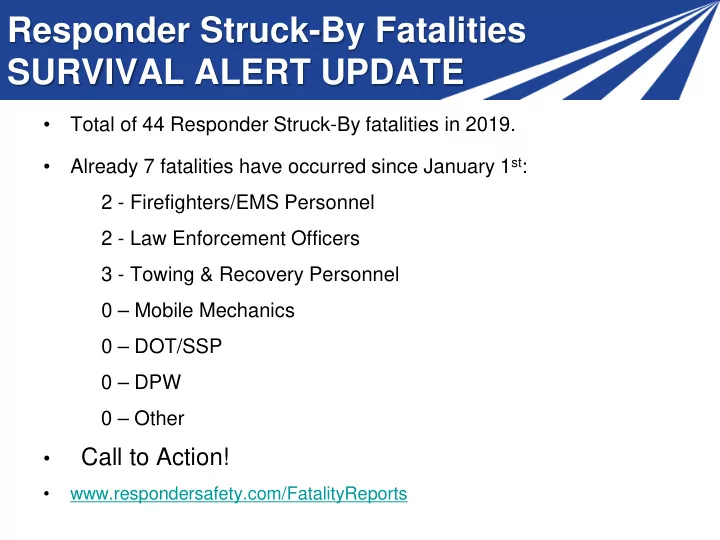

Responder Struck-By Fatalities SURVIVAL ALERT UPDATE • Total of 44 Responder Struck-By fatalities in 2019. Already 7 fatalities have occurred since January 1 st : • 2 - Firefighters/EMS Personnel 2 - Law Enforcement Officers 3 - Towing & Recovery Personnel 0 – Mobile Mechanics 0 – DOT/SSP 0 – DPW 0 – Other Call to Action! • • www.respondersafety.com/FatalityReports
National TIM Responder Training Program Implementation Progress - As of January 13, 2020 Train-the-Trainer Sessions • 456 sessions with 12,551 participants • 23% of participants have provided training In-Person Responder Training • 16,509 sessions with 376,591 participants Web-Based Training (WBT) • 65,879 total | 45,305 NHI | 6,013 Other • 14,561 ERSI Responder Safety Learning Network Total Trained: 455,021
TIM Training Program Implementation Progress Train-the-Trainer (TtT) Sessions - As of January 13, 2020 2 WA 2 NH ME VT ND MT 2 MN Canada OR MA NY ID WI 2 4 2 2 SD 4 MI 4 RI WY 2 2 PA CT 2 IA 2 3 NE 2 NJ 3 NV 3 OH 3 2 2 2 2 IL 2 2 DE 2 2 2 2 UT IN 2 3 WV MD CA CO 2 2 2 2 KS VA MO DC KY 2 2 NC 11 TN 3 2 2 16 2 2 FHWA Sponsored AZ 2 2 AR 3 8 SC NM TtT Session Conducted OK 3 2 2 AL 2 GA MS State/Local Led/Funded TtT Session Conducted 2 LA TX 2 FHWA and State/Local AK 2 2 3 Co-Sponsored 3 TtT Session Conducted FL 2 2 TtT Session Planned HI 2 2 PR 456 Number of TtT Sessions Conducted
TIM Training Program Implementation Progress TtT Session Participants - As of January 13, 2020 NH: Canada: 42 60 277 VT: 89 67 43 68 MA: 81 149 139 196 118 RI: 140 465 212 62 95 308 NJ: CT: 139 159 411 82 220 342 151 197 41 DE: 184 324 MD: 32 423 256 427 254 294 532 278 DC: 606 82 488 338 174 203 128 520 244 155 287 828 AK: 56 HI: PR: 100 234 12,551 Number of Trainers Trained
TIM Training Program Implementation Progress Responder Training: In-Person & WBT - As of January 13, 2020 NH: 2,119 Canada: 951 [186] 3,314 VT: [74] [1,533] 1,695 1,560 4,190 MA: 1,123 [141] [90] [121] 6,035 [15] 6,772 3,431 [655] [109] [51] 7,937 14,605 741 2,471 RI: [751] [274] [192] [189] 1,163 2,456 7,428 [64] [42] [300] 12,997 6,918 NJ: 9,387 [4,551] 14,718 CT: [156] 4,280 5,933 17,521 [541] [3,199] 821 14,759 [240] 2,005 [163] [685] 5,426 [544] [647] 8,040 [54] 26,359 [207] 4,475 MD: [1,546] 12,075 9,748 DE: [1,317] 17,717 [189] 6,843 [622] [1,636] 394 [7,187] [675] 23,515 [592] [274] 11,693 DC: 6,428 2,676 6,557 974 [2,076] 1,994 [441] [1,997] [751] [67] 8,617 [337] 1,514 4,368 [7,811] [682] 4,572 [169] 23,195 AK: [507] Mexico: 1,248 [18,105] 460 [1] [77] HI: PR: 581 7,984 [413] [33] Number of Responders Trained: In-Person - 376,591 Web-Based Training (WBT) - [65,879]
TIM Training Program Implementation Progress Total Trained - As of January 13, 2020 NH: Canada: 1,179 2,253 5,124 VT: 1,739 4,378 1,879 1,206 MA: 3,563 6,839 7,020 15,075 1,051 RI: 2,800 9,153 7,940 2,560 1,322 17,856 NJ: CT: 7,213 10,087 18,617 1,447 6,247 4,740 18,259 15,603 2,100 DE: 5,817 9,910 MD: 700 28,099 4,920 13,124 11,638 7,812 25,436 24,385 15,629 DC: 14,257 7,207 4,847 7,511 2,413 1,169 16,948 2,440 4,692 5,366 42,128 AK: Mexico: 1,249 593 HI: PR: 1,094 8,251 455,021 Total Trained
TIM Training Program Implementation Progress Percent Trained – Goal of 45% - As of January 13, 2020 NH: 31.4% 24.7% (7,175) (20,777) 23.2% VT: 67.2% 30.2% (7,510) 41.7% 16.5% (2,796) (3,993) MA: 67.9% (10,502) (21,542) 26.6% (10,068) 38.0% (26,350) 8.9% 56.8% 16.8% RI: 62.7% (39,698) (11,781) (4,930) (54,443) 35.1% 24.4% (4,080) (3,770) (32,555) CT: 46.4% 32.8% 35.8% NJ: 56.0% (54,500) (3,120) (20,139) 49.2% 62.5% 57.6% (18,000) 28.5% (29,798) (37,126) (8,224) 26.8% 20.5% DE: 14.8% (54,699) 49.8% (7,831) (30,546) (4,715) 59.3% (19,894) 42.3% 64.0% MD: 33.6% 35.7% (8,300) (31,000) (18,177) (23,218) (71,223) 42.3% (27,357) (57,680) DC: 36.9% 57.1% 54.7% 32.0% 45.6% 52.4% (6,534) 11.8% (26,061) (22,500) (10,627) (14,331) (9,932) 14.3% 25.8% 59.4% 5 0.1 - 14.9% Trained (17,103) (18,172) (28,532) 47.1% 6 15 - 24.9% Trained 53.8% AK: (78,309) (11,394) 12.4% 11 25 - 34.9% Trained (4,797) 9 35 - 44.9% Trained HI: PR: 9 45 - 54.9% Trained 33.5% 65.0% (3,270) 39.3% Percent Trained 12 55+% Trained (12,698) (1,158,265) Total Responders To Be Trained
TIM Training Program Implementation Progress Total Trained By Discipline - As of January 13, 2020 Law Enforcement 120,214 (31.1%) 386,366 Fire/Rescue 187,254 (51.2%) 366,006 EMS 31,678 (15.5%) 204,148 Transportation/Public Works 48,057 (59.5%) 80,707 Towing and Recovery 40,126 (53.9%) 74,425 Other Disciplines 27,692 (59.4%) 46,613 0 50,000 100,000 150,000 200,000 250,000 300,000 350,000 400,000 450,000 Total Trained Total To Be Trained * The NHI WBT total for the time period between 10/01/14 and 09/30/16 is reported as "Other Disciplines"
National Goal 9
2020 TIM Training Plan? • What is your plan to train the balance of your responders in your state? • Do you need to refresh your TIM trainers? When is your next TIM Committee meeting? • Stakeholders? • Local Technical Assistance Program (LTAP)? 10
FHWA Office of Operations Thank you, be safe! Jim Austrich James.Austrich@dot.gov 202-366-0731 Paul Jodoin Paul.Jodoin@dot.gov (202) 366-5465 11
Recommend
More recommend