
SLIDE 1
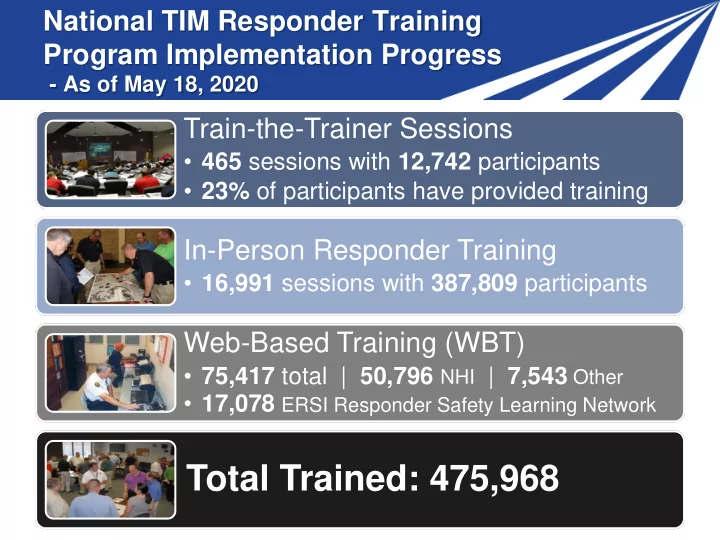
National TIM Responder Training Program Implementation Progress
- As of May 18, 2020
Train-the-Trainer Sessions
- 465 sessions with 12,742 participants
- 23% of participants have provided training
In-Person Responder Training
- 16,991 sessions with 387,809 participants
Web-Based Training (WBT)
- 75,417 total | 50,796 NHI | 7,543 Other
- 17,078 ERSI Responder Safety Learning Network