
SLIDE 1
Experience fr from Two Years of f Vis isualizing Fla lash wit - - PowerPoint PPT Presentation
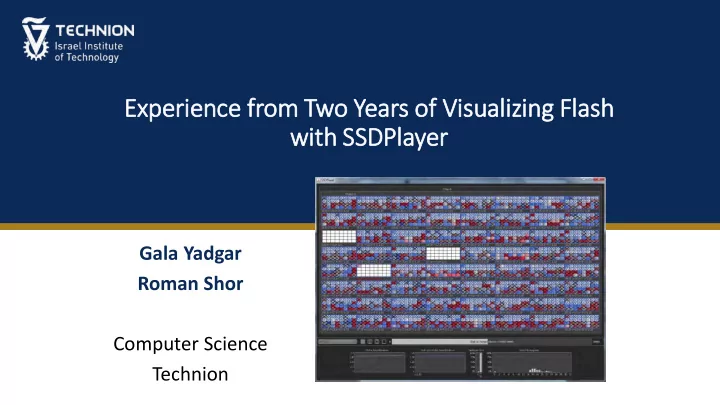
Experience fr from Two Years of f Vis isualizing Fla lash wit ith SSDPlayer Gala Yadgar Roman Shor Computer Science Technion 1854 Broad Street cholera outbreak 2 Images taken from Wikipedia -
Images taken from Wikipedia - https://en.wikipedia.org/wiki/1854_Broad_Street_cholera_outbreak
2
3
Images taken from Wikipedia - https://en.wikipedia.org/wiki/Scientific_visualization
4
page64 page1 block1 block256 page64 page1 page64 page1 block1 block256 page64 page1 page64 page1 block1 block256 page64 page1
Chip 0 Plane 0 Block 0: 94 53 95 42 61 86 62 16 2 … Block 1: 26 37 79 22 30 17 48 94 4 … Block 2: 28 63 44 70 26 46 42 51 47 … Block 3: 75 67 45 12 72 88 90 37 19 … Block 4: 91 80 18 34 91 91 45 51 45 … Block 5: 54 56 70 34 49 87 59 54 82 … … Chip 0 Plane 1 Block 0: 97 81 42 75 13 12 84 69 86 … Block 1: 94 70 48 22 81 48 89 24 100 … Block 2: 69 28 86 42 58 88 16 38 68 … … … … …
5
http://ssdplayer.cswp.cs.technion.ac.il/demos/greedy-zipf/ 6
page frame color texture continuous histograms states and stats chip plane block zoom levels and details
7
http://ssdplayer.cswp.cs.technion.ac.il/sample-page/hotcold-1/
8
http://ssdplayer.cswp.cs.technion.ac.il/demos/hotcold-5/
http://ssdplayer.cswp.cs.technion.ac.il/demos/large-hotcold-5/ 10
http://ssdplayer.cswp.cs.technion.ac.il/demos/llh-ftl-msr/
Replay of FTL with reusable pages, implemented on OpenSSD board. Presented at FAST’16
“The Devil Is in the Details: Implementing Flash Page Reuse with WOM Codes” [Margaglia, Yadgar, Yaakobi, Li, Schuster, Brinkmann] 11
http://ssdplayer.cswp.cs.technion.ac.il/demos/raid5-parity/ 12
http://ssdplayer.cswp.cs.technion.ac.il/demos/raid5-separate-parity/ 13
14