www.hatchmott.com
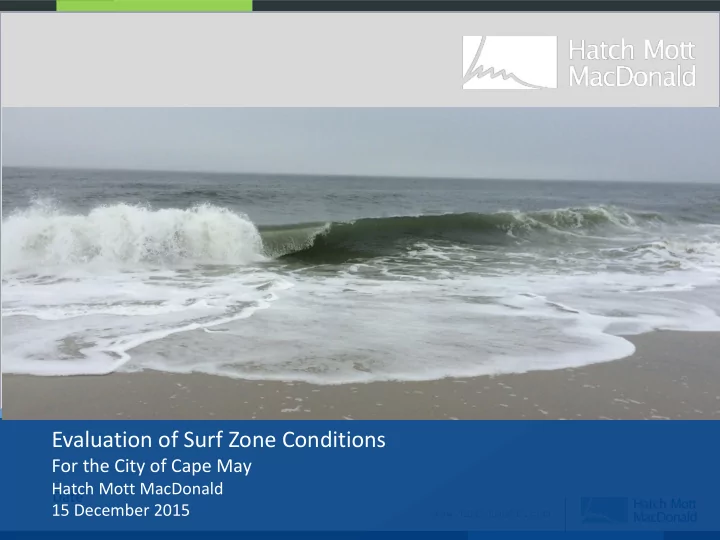
Evaluation of Surf Zone Conditions For the City of Cape May Hatch - - PowerPoint PPT Presentation
Replace entire gray box with one of your presentations images (bleed across the screen). Evaluation of Surf Zone Conditions For the City of Cape May Hatch Mott MacDonald Date 15 December 2015 www.hatchmott.com Evaluation of Surf Zone
www.hatchmott.com
- Outline of presentation:
- Introduction and Background
- Wave Assessment
- Grain Size Evaluation
- Beach Slope Evaluation
- Alternatives
- Numerical Model Results
- Recommendations
- Note: The information in this presentation is strictly engineering based,
with no implied or actual health/medical recommendations.
Evaluation of Surf Zone Conditions
www.hatchmott.com
Cape May, Looking South
Source: USACE
www.hatchmott.com
Gurney Avenue, Cape May
Source: USACE
www.hatchmott.com
Philadelphia Avenue, Cape May
Source: USACE
www.hatchmott.com
Baltimore Avenue, Cape May
Source: USACE
www.hatchmott.com
USCG Station – Cape May Inlet Jetty – Buffalo Ave./Yeaton Road Cape May – Cape May Beach Club – Third Avenue groin
Cape May’s Beaches
www.hatchmott.com
OLD Design: Federal Project (per Phase II GDM, 1983)
Design Berm Elevation: 8.0 ft NGVD 29
Design Berm Slope: 1V:25H
Design Berm Width: 25 -130 ft.
Nourishment interval: 2 years
CURRENT Design: Federal Project (per USACE FY 09 Monitoring Report)
Design Berm Elevation: 6.7 ft NAVD 88
Design Berm Slope: 1V:10H
Design Beach Width (Design Baseline to MLW (-2.8 ft NAVD 88)): 268 ft.
Nourishment interval: 2 years
Change in Beach Fill Templates
www.hatchmott.com
Historical Sediment Samples
Sediment Results from McMaster (1954) Sample Number Location Position on Beach Median Grain Size 127 0.17 miles south of harbour jetty, Sewell Pt. Cape May Berm crest 0.130 mm 128 (compare to CRC #108) 0.31 miles north of Wilmington Ave., Cape May 20 ft below berm crest on 6o slope (1V:9.5H) 0.357 mm 129 (compare to CRC #107) 0.28 miles north of Madison Ave., Cape May Beach controlled by
- seawall. 15 ft from
wall on 3o slope (1V:18H) 0.157 mm 130 Perry Street, Cape May 15 ft below berm crest on 6o slope (1V:9.5H) 0.182 mm
Earliest known publically available data for NJ from the McMaster (1954) report
www.hatchmott.com
Historical Sediment Samples
Sediment Results from USACE (1983) Sample Number Location Position on Beach Median Grain Size 121 USCG, Sewell Pt. Cape May Berm High tide Mid tide 0.163 mm 0.139 mm 0.187 mm 122 Baltimore Avenue, Cape May Mid tide 0.154 mm 123 Municipal Pier, Cape May High tide Mid tide 0.144 mm 0.132 mm
www.hatchmott.com
Recent (Oct. 2015) Sediment Samples
2015 Data Collection by Hatch Mott MacDonald Sample Number Location Position on Beach Median Grain Size 108 Cape May Beach Club, Cape May High tide Mid tide Low tide 0.350 mm 0.450 mm 0.410 mm 107 Baltimore Avenue, Cape May High tide Mid tide Low tide 0.370 mm 0.470 mm 0.460 mm 206 South Broadway Ave., Cape May High tide Mid tide Low tide 0.360 mm 0.420 mm 0.430 mm
www.hatchmott.com
Historical Profile Locations
Howard St. Baltimore Ave.
www.hatchmott.com
- 25
- 20
- 15
- 10
- 5
5 10 15 200 400 600 800
Elevation (ft NAVD88) Distance from Baseline (ft)
USACE Profile CM020 (Near Howard Street)
CM020 1987_03 CM020 2006_09 CM020 2014_09
- Sep. ‘14
Howard Street Historical Profiles
Data from USACE
Profiles for March 1987 (blue line), September 2006 (red line), and September 2014 (green line) MHW (approx.) MLW (approx.)
- Mar. ‘87
- Sep. ‘06
www.hatchmott.com
- 25
- 20
- 15
- 10
- 5
5 10 15 200 400 600 800
Elevation (ft NAVD88) Distance from Baseline (ft)
USACE Profile CM020 (Near Howard Street)
CM020 1987_03 CM020 2006_09
- 25
- 20
- 15
- 10
- 5
5 10 15 200 400 600 800
Elevation (ft NAVD88) Distance from Baseline (ft)
USACE Profile CM020 (Near Howard Street)
CM020 1987_03 CM020 2006_09 CM020 2014_09
- Sep. ‘14
- Mar. ‘87
- Sep. ‘06
Howard Street Historical Profiles
Data from USACE
Profiles for March 1987 (blue line), September 2006 (red line), and September 2014 (green line) MHW (approx.) MLW (approx.) 10 ft 10 ft
www.hatchmott.com
Baltimore Ave. Historical Profiles
Data from Stockton University NJ Beach Profile Network database
Profiles for October 1986 (red dashed line) and August 2006 (black solid line) MHW (approx.) MLW (approx.)
- Oct. ‘86
- Aug. ‘06
www.hatchmott.com
Baltimore Ave. Historical Profiles
Data from Stockton University NJ Beach Profile Network database
Profiles for September 2015 (red dashed line) and October 2015 (black solid line) MHW (approx.) MLW (approx.)
- Sep. ‘15
- Oct. ‘15
www.hatchmott.com
Waves
WIS Station No. 63152 Analysis Results for a 2 ft Wave Parameter Value Average Tm for Hmo = 2 ft 6.6 seconds Average θ for Hmo = 2 ft and Tm = 6.6 ± 0.01 seconds 124º from True North
Cape May City
USACE Wave Information Studies (WIS) Station 63152 Data
1980 - 2012
(USACE WIS)
www.hatchmott.com
Howard Street
www.hatchmott.com
Typical wave beaker types:
– Spilling – Plunging – Collapsing – Surging
Wave Breaker Type
Galvin (1968)
www.hatchmott.com
Wave breaker type can be determined by the Surf Similarity Parameter/Iribarren number, 𝜊0 :
𝜊0 =
𝑢𝑏𝑜𝛾
𝐼0 𝑀0
(Battjes, 1974)
Where: » 𝑢𝑏𝑜𝛾 = Slope » 𝐼0 = Offshore wave height » 𝑀0 = Deep water wavelength
Wave Breaker Type
Wave breaker type range:
– Collapsing or Surging: 3.3 < 𝜊0 – Plunging: 0.5 < 𝜊0 < 3.3 – Spilling: 𝜊0 < 0.5
www.hatchmott.com
Wave Breaker Type
0.00 0.50 1.00 1.50 2.00 2.50 3.00 3.50 0.000 0.050 0.100 0.150 0.200 0.250 0.300 0.350
Surf Similarity Parameter Beach Profile Slope (tan β)
Calculated Surf Similarity Parameter Based on Slope
Collapsing or Surging Plunging Spilling
Expected Breaker Type
www.hatchmott.com
Wave Breaker Type
0.00 0.50 1.00 1.50 2.00 2.50 3.00 3.50 0.000 0.050 0.100 0.150 0.200 0.250 0.300 0.350
Surf Similarity Parameter Beach Profile Slope (tan β)
Calculated Surf Similarity Parameter Based on Slope
Collapsing or Surging Plunging Spilling
Expected Breaker Type Change between spilling and plunging breaker type
- ccurs at a 1V:21H slope
www.hatchmott.com
Expected Wave Breaker Types
Profile Slope Surf Similarity Parameter Expected Breaker Type Baltimore Ave. 1986 1V:40.7H 0.26 Spilling Baltimore Ave. 2015 1V:7.6H 1.40 Plunging Hypothetical A 1V:10H 1.06 Plunging Hypothetical B 1V:25H 0.42 Spilling
www.hatchmott.com
Wave Model Results
Baltimore Ave. 1986 Profile: 1V:40.7H Baltimore Ave. 2015 Profile: 1V:7.6H
www.hatchmott.com
Turbulent Dissipation (Joules/(kg/s))
Hypothetical Profile: 1V:25H Slope Hypothetical Profile: 1V:10H Slope
Energy dissipation is more rapid in the plunging wave for 1V:10H than 1V:25H
Energy dissipation is confined to a smaller region in the plunging wave for 1V:10H than 1V:25H
www.hatchmott.com
Alter Beach Slope – Baltimore Avenue
(Initial design investigation)
- 20
- 15
- 10
- 5
5 10 15 20 100 200 300 400 500 600 700 800
Elevation (ft NAVD88) Distance from Baseline (ft)
Baltimore Ave. Alternative
Alternate Profile with 1V:25H slope 9.17.2015 Stockton Survey Alternate 1V:25H
- Sep. ‘15
www.hatchmott.com
Alter Beach Slope – Baltimore Avenue
(Initial design investigation)
- 20
- 15
- 10
- 5
5 10 15 20 100 200 300 400 500 600 700 800
Elevation (ft NAVD88) Distance from Baseline (ft)
Baltimore Ave. Alternative
Alternate Profile with 1V:25H slope 9.17.2015 Stockton Survey MHW (approx.) MLW (approx.)
- Sep. ‘15
Alternate 1V:25H
www.hatchmott.com
Alter Beach Slope – Baltimore Avenue
(Initial design investigation)
- 20
- 15
- 10
- 5
5 10 15 20 100 200 300 400 500 600 700 800
Elevation (ft NAVD88) Distance from Baseline (ft)
Baltimore Ave. Alternative
Alternate Profile with 1V:25H slope 9.17.2015 Stockton Survey MHW (approx.) MLW (approx.) 10 ft 10 ft
- Sep. ‘15
Alternate 1V:25H
www.hatchmott.com
Alter Beach Slope – Howard Street
(Initial design investigation)
- 30
- 25
- 20
- 15
- 10
- 5
5 10 15 100 200 300 400 500 600 700 800 900 1000
Elevation (ft NAVD88) Distance from Baseline (ft)
Howard St. Alternatives
Alternative 1 Alternative 2 USACE CM020 2014_09 Alternative 2 1V:25H Alternative 1 1V:25H Sep ‘14
www.hatchmott.com
Alter Beach Slope – Howard Street
(Initial design investigation)
- 30
- 25
- 20
- 15
- 10
- 5
5 10 15 100 200 300 400 500 600 700 800 900 1000
Elevation (ft NAVD88) Distance from Baseline (ft)
Howard St. Alternatives
Alternative 1 Alternative 2 USACE CM020 2014_09 MHW (approx.) MLW (approx.) Alternative 2 1V:25H Alternative 1 1V:25H Sep ‘14
www.hatchmott.com
Alter Beach Slope – Howard Street
(Initial design investigation)
- 30
- 25
- 20
- 15
- 10
- 5
5 10 15 100 200 300 400 500 600 700 800 900 1000
Elevation (ft NAVD88) Distance from Baseline (ft)
Howard St. Alternatives
Alternative 1 Alternative 2 USACE CM020 2014_09 MHW (approx.) MLW (approx.) 15 ft 15 ft Alternative 2 1V:25H Alternative 1 1V:25H Sep ‘14
www.hatchmott.com
Alter Beach Slope – Initial Quantity Estimates
(Initial design investigation)
Eastern Section (Yeaton to Philadelphia) – Cut 28.5 cy/l.f. from beach face – Approximately 154,000 cubic yards Western Section (Philadelphia to Third Ave) – Alternative 1: Cut 21.0 cy/l.f. from beachface – Approximately 168,000 cubic yards – Alternative 2: Cut and fill 120 cy/l.f. – Approximately 816,000 cy of additional sand needed – Extends beyond the end of the groins
www.hatchmott.com
Groins
Location Inner End El. NAVD Outer End El. NAVD Length Feet Baltimore 7.14 7.14 220 Trenton 7.14 7.14 220 Philadelphia 6.14 4.14 360 Queen 4.14 4.14 572 Gurney 7.14 4.14 425 Jackson 6.84 4.14 650 Grant/Windsor 7.14 4.14 673 Patterson 6.14 4.64 370 Third Ave. 8.14 4.14 786
www.hatchmott.com
Groins
(Initial design investigation)
Grant Avenue Groin is too high and has a large offset to the neighboring beach
– Reduce elevation to 6.14 ft NAVD 88 and shorten
Jackson Avenue Groin has a large offset to the neighboring beach Reduce elevation to 6.14 ft NAVD 88 and shorten
Gurney Avenue Groin is too high, but because it is short, the impact is less
– No change
www.hatchmott.com
Groins
(Initial design investigation)
Grant Avenue Groin is too high and has a large offset to the neighboring beach
– Reduce elevation to 6.14 ft NAVD 88 and shorten
Jackson Avenue Groin has a large offset to the neighboring beach Reduce elevation to 6.14 ft NAVD 88 and shorten
www.hatchmott.com
Mechanically alter the foreshore slope Alter groins – Lower crest height and shorten selected groins Decrease the grain size of future corps beachfills – Unlikely to have any affect
Project Alternatives
www.hatchmott.com
Federal (USACE)
– The USACE regulates activities that take place in navigable waters under
Section 10 of the Rivers and Harbors Act of 1899. The United States Army Corps of Engineers (USACE) regulates activities that take place in navigable waters under Section 9 and 10 of the Rivers and Harbors Act of 1899 and waters under Section 404 of the Clean Water Act. This Act prohibits the
- bstruction or alteration of “waters of the US” without a permit from the Corps
- f Engineers. Proposed beach grading activities that will take place below the
high tide line will require authorization by a USACE Individual Permit.
– The Cape May beach is an USACE engineered beach therefore beach activities
that may take place in support of the Surf Zone Study will require authorization to alter a USACE Civil Works Project pursuant to 33 USC 408.
Federal and State Permits and Authorizations
www.hatchmott.com
State (NJDEP)
– Under the NJDEP Coastal Zone Management Rules N.J.A.C. 7:7-2.2, a CAFRA
permit shall be required for any development in the CAFRA area located on a beach or dune.
– Under the NJDEP Coastal Zone Management Rules N.J.A.C. 7:7-2.4, a
Waterfront Development permit shall be required for any activities in any tidal waterway up to and including the mean high water line.
– The City of Cape May currently has a valid Coastal Permit for beach and dune
maintenance activities. Specifically, the bulldozing of sand from the upper beach (berm) to the lower beach (beach face), for the purpose of increasing the berm width or flattening the beach profile, is not considered to be routine maintenance and is not authorized by this permit.
Federal and State Permits and Authorizations
www.hatchmott.com
City-wide, it is unlikely that the Federal beachfill project has resulted in a steepening of the beach slope in the surf zone
– There is natural variation and information from 1954 that indicates that
approximately 1V:10H in the surf zone may be a natural slope
Sand grain size has become slightly coarser since the beachfills
– Altering the grain size currently on the beach is not a realistic option
Based on previous USACE attempt to alter the slope (2011), changes will not be permanent
– Therefore, maintaining an unnaturally gentle slope (1V:25H) will likely require
maintenance during the course of the summer months
– Will require permits – Alternative 2 (depicted at Howard Street) which requires additional sand is
unfeasible from a performance perspective
Findings and Recommendations
www.hatchmott.com
The Recommended Project is:
Pre-summer only, beach slope adjustment from Queen Street to Grant Street
– Sand will be mechanically moved to downdrift sides of groins, into the surf
zone, and into dunes where beneficial to provide a uniform 1V:25H slope to MLW.
– Any excess sand is to be trucked to Wilmington Ave
Primary project purpose is to alter the wave breaking from plunging to spilling
Secondary project purpose is to provide increased resiliency to dunes in the areas flooded by Sandy
Recommended for further study:
– Altering groins may result in locally gentler slopes (updrift side) and less impact
to shoreline, however this option is very expensive and may result in less beach width between Queen Street and Broadway.
Findings and Recommendations
www.hatchmott.com
Recommended Plan
Dune width enhancement Cut & fill to achieve 1:25 slope
www.hatchmott.com