Estimation of urban bioclimate by micro scale models for the - - PowerPoint PPT Presentation

estimation of urban bioclimate by micro scale
SMART_READER_LITE
LIVE PREVIEW

Estimation of urban bioclimate by micro scale models for the - - PowerPoint PPT Presentation

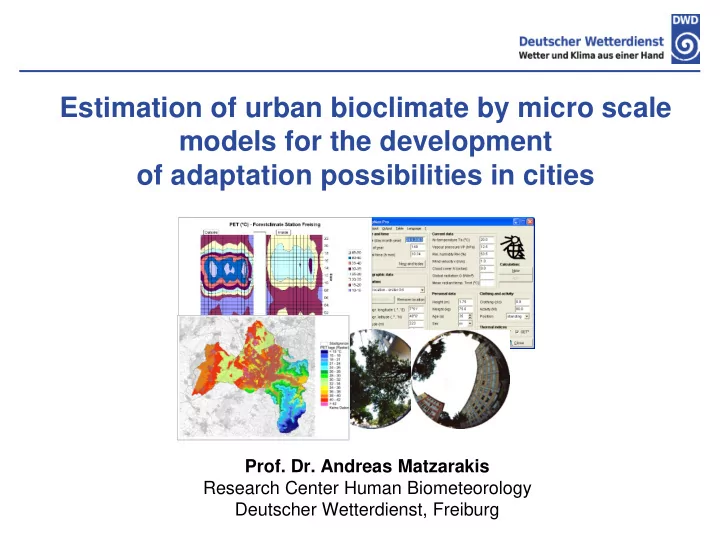
Estimation of urban bioclimate by micro scale models for the development of adaptation possibilities in cities Prof. Dr. Andreas Matzarakis Research Center Human Biometeorology Deutscher Wetterdienst, Freiburg Outlook/Questions


slide-1
SLIDE 1

Estimation of urban bioclimate by micro scale models for the development

  • f adaptation possibilities in cities
  • Prof. Dr. Andreas Matzarakis

Research Center Human Biometeorology Deutscher Wetterdienst, Freiburg

slide-2
SLIDE 2

 Quantification of climate for cities Air temperature? – Equivalent temperature (thermal indices)  Measurements and simulations Micro scale models  Quantification of urban spaces Long term analysis Hot spot analysis Climate change data/simulations  Data visualization and transfer

Outlook/Questions

slide-3
SLIDE 3

Target: Human / Method Models Application and examples

slide-4
SLIDE 4

Assessment of effects of climate Not only air temperature Air humidity Wind Radiation Thermo-physiology (activity and clothing) Energy balance of humans Physiologically Equivalent Temperature Thermal index

(Matzarakis, 2007)

Effect of the thermal atmosphere

slide-5
SLIDE 5

Under stationary conditions due to priciples of thermodynamics: total of input energies = total of output energies

H + Q* + QH +QL + QSw + Qre = 0

H: internal heat production (metabolic heat production - heat loss due to physical (mechanical) work) Q*: net radiation (radiative heat flux) QH: turbulent flux of sensible heat (convection heat flux), interchange of sensible heat between the surface of the body and the ambient air QL: turbulent flux of latent heat due to water vapour diffusion through the skin into the ambient air QSw: turbulent flux of latent heat due to sweat evaporation Qre: heat flux due to respiration (heating and humidification of respired air)

Human energy balance

(VDI, 1998, Matzarakis, 2001)

slide-6
SLIDE 6

Physiologically Equivalent Temperature (PET):

Modern Thermal Indices

(derived thermal indices: PMV, PET, SET*, PT, UTCI)

T

core

TSkin

1.1 m

Ta

v

VP

Tmrt

Tmrt = Ta

v =0.1m

/s

VP = 12 hPa

T

core

TSkin

1 . 1 m

Definition: Mwork = 80 W Icl = 0.9 clo PET of 20 °C means thermal comfort

Thermal indices

slide-7
SLIDE 7

Thermal indices (PMV, PET), Thermal perception, Physiological stresss

Threshold values of thermal indices PMV and PET for different grades of thermal sensitivity of human beings and physiological stress on human beings (according to Matzarakis and Mayer, 1996)

Adjustment of scale (new): Taiwan, Israel, (Nigeria), Greece, Hungary, …

Thermal indices – Assessment scale

slide-8
SLIDE 8

Target: Human / Method Models Application and examples

slide-9
SLIDE 9

Micro scale models (free available)

 SkyHelios  RayMan  ENVI-met  Solweig

slide-10
SLIDE 10

RayMan Pro - A Tool for Applied Climatology

(urban climatology, human-biometeorology, tourism climatology, …)

Sunshine duration Sun paths Shadow Global radiation Mean radiant temperature Predicted Mean Vote (PMV)

  • Phys. Equiv. Temp. (PET)
  • Stand. Effec. Temp. (SET*)

Universal Thermal Climate Index (UTCI) Perceived Temperature (pT) new: mPET Simple environments Complex environments Topography Fish-Eye

  • Hemisph. input/SVF

Meteo data Climate data ....

slide-11
SLIDE 11

Vector and grid data Google Earth implementation Interfaces and outputs for RayMan Interface/Output for Climate Mapping Tool Sun paths Sun duration/diagram Shade Sky view factor(s) Roughness Local climate zones (partially) Global radiation Mean radiant temperature Wind speed and direction PET and UTCI

SkyHelios

slide-12
SLIDE 12

Target: Human / Method Models Application and examples

  • Events (popular examples)
slide-13
SLIDE 13

Events – Sports

Images: the guardian

slide-14
SLIDE 14

Exposition: Air condition

  • HVAC
  • Transfer/Transportation
  • Adaptation humans

Images: the guardian

slide-15
SLIDE 15

Climate data – Climate diagram FIFA 2022

(Matzarakis and Fröhlich, 2015)

slide-16
SLIDE 16

FIFA 2022

Los Angeles Time,

  • 23. August 2014
slide-17
SLIDE 17

Doha, Ta, PET

Period: March 1999 to Jan 2014 (Matzarakis and Fröhlich, 2015)

FIFA 2022

slide-18
SLIDE 18

Controverse

  • Suggestion: Winter
  • Contra: we can cool everything
  • FIFA: now in Winter
  • Diverse reactions and perceptions
slide-19
SLIDE 19

Target: Human / Method Models Application and examples

  • Political pressure (Freiburg)
slide-20
SLIDE 20

Environmental pressure (pop, politics)

slide-21
SLIDE 21

Fröhlich and Matzarakis, 2012

ENVI-met

Results: ENVI-met

slide-22
SLIDE 22

05/24/11

Day 3 (13:00)

Fröhlich and Matzarakis, 2013

ENVI-met

Results: ENVI-met

slide-23
SLIDE 23

After reconstruction

Fröhlich and Matzarakis, 2013

ENVI-met

Results: ENVI-met

slide-24
SLIDE 24

SVF before

MP1 Green area MP2 KG I - North MP3 KG II - North MP4 UB - Northeast MP5 Theatre MP6 KG II - Middle MP7 Bus stop

Fröhlich and Matzarakis, 2013

Results: SkyHelios

slide-25
SLIDE 25

SVF after - Place of Old Synagogue

MP1 Green area MP2 KG I - North MP3 KG II - North MP4 UB - Northeast MP5 Theatre MP6 KG II - Middle MP7 Bus stop

MP PET35 PET35a Δ (h) 1

348.1 338.1

  • 10

2

196.2 207.2 11

3

322.4 329.1 6.7

4

302.6 273.5 -29.1

5

313.9 313.3

  • 0.6

6

275.9 218.1 -57.8

7

204.4 330.2 125.8

Fröhlich and Matzarakis, 2013

Effect: wind and Tmrt

Results: RayMan Pro/SkyHelios

SVF

slide-26
SLIDE 26

Target: Human / Method Models Application and examples

  • Fundamental studies (aspect ratio, orientation)
slide-27
SLIDE 27

Urban canyon – basic analysis

Typical urban canyons in Freiburg Rotation of canyons

Input Co-ordinates Buildings/solid surfaces

slide-28
SLIDE 28

15 m 5 m 10 m 15 m 20 m 25 m 30 m 35 m 40 m

Building: 15 m, variable street width

Matzarakis and Herrmann, 2011

Urban canyon – street variability

slide-29
SLIDE 29

15 m

Street width 15 m, variable building height

40 m 35 m 30 m 25 m 20 m 15 m 10 m 5 m

Matzarakis and Herrmann, 2011

Urban canyon – building height variability

slide-30
SLIDE 30

Street width 15 m, Building height 15 m, Rotation

0 ° 15 ° 30 ° 45 ° 60 ° 75 ° 90 ° 105 ° 120 ° 135 ° 150 ° 165 ° 180 ° N W E S

Matzarakis and Herrmann, 2011

Urban canyon – orientation

slide-31
SLIDE 31

Adaptation measures – Street canyon

Ketterer & Matzarakis, 2014

  • bject: middle of a street canyon model:

RayMan data: 2000 -2010 cold stress PET < 13 °C heat stress PET > 29 °C thermal comfort 13.1 °C < PET < 29 °C thermal comfort/ street orientation 0 ° 15 ° 30 ° 45 ° 60 ° 75 ° 90 ° 105 ° 120 ° 135 ° 150 ° 165 °

slide-32
SLIDE 32

Target: Human / Method Models Application and examples

  • Trees
slide-33
SLIDE 33

Positive/Negative

slide-34
SLIDE 34

Outside Inside

Data: Landesanstalt für Wald und Forst, München, Question: Forests and bioclimate during heat waves ?

Matzarakis, 2010

Heat wave 2003 - Ta

slide-35
SLIDE 35

Heat wave August 2003 - PET

Outside Inside

Matzarakis, 2010

Data: Landesanstalt für Wald und Forst, München, Question: Forests and bioclimate during heat waves ?

slide-36
SLIDE 36

50 100 150 200 250 300 350 400 450 500

  • 22-17-12 -7 -2

3 8 13 18 23 28 33 38 43 48 53 58 Frequency PET (°C)

PET frequency distribution for Freiburg, 2071-2100

1961-1990 PET Tmrt = Ta v-1 v+1

(Matzarakis and Endler, 2010)

Climate change and adaptation (shade/wind)

< 1973 1973 - 2000 2002 Post 2002 2006-2009 2009 2010-2013 Future

slide-37
SLIDE 37

Target: Human / Method Models Application and examples

  • Communication aspects
slide-38
SLIDE 38

 First level of information: qualitative  Second level of information: quantitative  Third level: way of transferring information  Most important level: communication of information

Data and information

slide-39
SLIDE 39

Cold air production

Ventilation

Public transportation Shade

(Sheet: Köhler, 2008)

Vision from an urban planner

slide-40
SLIDE 40

 Not only air temperature – Human Biometeorology  Appropriate data and information  Measurements and simulations  Urban areas - modelling  Combination of methods/data  No clickable solutions  Less case studies – more long term (H/W)  Models provide additional data: SD, Sun paths, …  Focus Radiation and wind  Recommendations to users of models Validation Consider possibilities and limitation – aim of development PLEASE: read/consider manual

Statements/Summary