
SLIDE 1
| EMAAR PROPERTIES
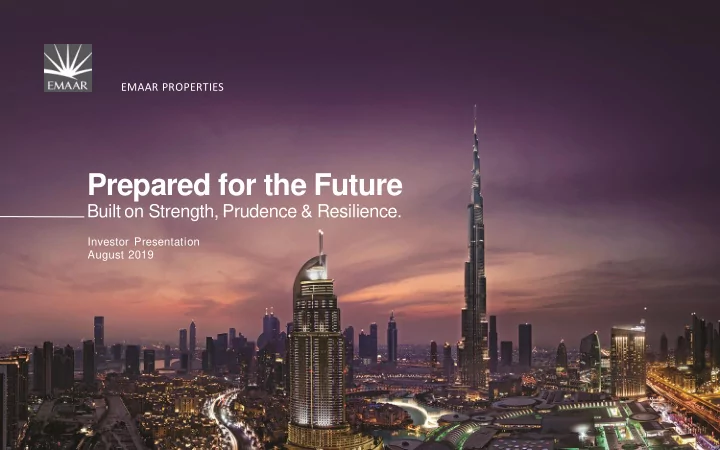
EMAAR PROPERTIES
Prepared for the Future
Built on Strength, Prudence & Resilience.
Investor Presentation August 2019
Prepared for the Future Built on Strength, Prudence & - - PowerPoint PPT Presentation
EMAAR PROPERTIES Prepared for the Future Built on Strength, Prudence & Resilience. Investor Presentation August 2019 0 | EMAAR PROPERTIES Disclaimer Emaar Properties PJSC, for themselves and for Emaar Group, give notice that: The
| EMAAR PROPERTIES
EMAAR PROPERTIES
Investor Presentation August 2019
1 | EMAAR PROPERTIES
Emaar Properties PJSC, for themselves and for Emaar Group, give notice that: The particulars of this presentation do not constitute any part of an offer or a contract. Given that the presentation contains information based on forecasts and roll outs, all statements contained in this presentation are made without responsibility on the part of Emaar Properties PJSC, their advisors, or members of Emaar Group (including their directors, officers and employees). None of the statements contained in this presentation is to be relied upon as a statement or representation of fact. All parties must satisfy themselves as to the correctness of each of the statements contained in this presentation. Emaar Properties PJSC and members of the Emaar Group do not make or give, and neither members of the Emaar Group nor any of their directors or officers or persons in their employment or advisors has any authority to make or give, any representation or warranty whatsoever in relation to this presentation. This presentation may not be stored, copied, distributed, transmitted, retransmitted or reproduced, in whole or in part, in any form or medium without the permission of Emaar Properties PJSC.
25 August 2019 Page 1
2 | EMAAR PROPERTIES
Investing In Emaar Expanding Footprint in UAE & International Markets Business Strategy & Outlook H1 2019 Results Update Annexure
3 | EMAAR PROPERTIES
4 | EMAAR PROPERTIES 4
Our Business Model:
We operate a business model that puts risk mitigation at the centre of our core strategies. We create value by providing high quality and highly desirable environments, which help our discerning customers to succeed today, and in the future. Our properties are also inclusive places, which foster opportunities and contribute positively to their neighbourhoods
Our Purpose:
Our purpose is to be the most admired realty group globally, that transforms the lives of its occupiers, and thus deliver sustainable long-term income and wealth creation
5 | EMAAR PROPERTIES
Creator of World-Renowned Architectures
Burj Khalifa – Tallest Building in the World Dubai Mall – Most Visited Mall in the World (Owner) Dubai Creek Tower – World’s tallest tower in the making Dubai Fountain – World’s largest choreographed musical fountain
Proven Execution in UAE & International Markets
Residential Units sold since 2002
Residential Units delivered since 2002
1.6 Bn sq. ft. land bank in key countries
Global Ranking1 in Listed Real Estate Space
Real Estate Space
Market Cap: 1st in MENA2 (under MSCI EM Index) Net Profit: 23rd in EM (1st excl. China) Revenue: 24th in EM (1st excl. China)
Landmark Hospitality Assets
21 Hotels with c. 4,679 keys Established brands: Address Hotels & Resorts, Vida Hotels & Resorts, Rove Hotels Asset-light model for growth: 30 hotels in pipeline with 2/3rd under management contract
1) Source: Factset, 2) As on 6th Aug 2019, 3) Calculated over 2014 to 2018, 4) Includes Emaar Square Mall in Turkey with 1.6 sq. ft. GLA, 5) Taken as on H1 2019
Preferred Shopping Malls & Retail Centres
Omnichannel Owns & operates GLA of 8.3 Mn sq. ft. globally4, incl. 6.7 Mn sq. ft. in Dubai presence through Namshi Namshi – Revenues 50% CAGR3, NMV 52% CAGR3
Strong Revenue Visibility
Solid Revenue Backlog AED 49.2 Bn globally (AED 37.8 Bn in UAE) Robust recurring businesses5 31% Recurring Revenues (46% of EBITDA)
6 | EMAAR PROPERTIES
Resilient Business Model With Strong Future Growth Potential
5,367 5,788 5,974 6,311 7,202 1,870 2,620 2,667 3,584 3,081 2,656 5,253 6,899 8,857 15,411 2014 2015 2016 2017 2018 UAE Development International Development Malls, Hotels & Entertainment (Recurring Revenues) 9,893 13,661 15,540 18,752 25,694 27% : 55% CAGR : 13% CAGR : 8% CAGR Total Revenues
In AED Mn
✓ Consistent growth delivered in difficult market environment post 2014 oil price crash ✓ Good business mix with strong upside potential in development business, supported by steadily growing recurring businesses ✓ Significant value to be un-locked in the international operations (large land-bank) ✓ Hospitality & Entertainment businesses looking to expand outside UAE, in other GCC markets
7 | EMAAR PROPERTIES
34% 29% 38% 303% 26% 20% 72% 18% 2011 2012 2013 2014 2015 2016 2017 2018 4% 3% 2% 21% 3% 2% 8% 4% 2011 2012 2013 2014 2015 2016 2017 2018 0.6 0.6 1.0 10.0 1.1 1.1 4.0 1.1 2011 2012 2013 2014 2015 2016 2017 2018
Strong Track Record and Proven Expertise To Generate Healthy, Predictable And Sustainable Returns
Attractive Dividend Yield Robust Dividend Payout Ratio AED 19.4 Bn Cumulative Dividends declared over 2011-2018
In AED Bn
8 | EMAAR PROPERTIES
Solid Credit Profile with very Comfortable Net Debt-to-Equity and Significant Debt Coverage
Comfortable Debt Maturity Profile – June 2019 AED Million June 2019 Debt 22,339 Cash 7,790 Net Debt 14,549 Equity 59,713 Total Assets 116,276 Key Ratios June 2019 Debt / Equity 0.4 Debt / Total Assets 0.2 Net Debt / EBITDA1 1.4 EBITDA1 / Interest2 9.3 Credit Rating BBB- / Baa3
Emaar Properties, Emaar Malls & Emaar Development Sukuk 2, Turkey & International Emaar Development, Turkey & International International Turkey & Emaar Development Emaar Malls Sukuk & Emaar Properties Sukuk 3
1) Calculated using Trailing Twelve Months (TTM) EBITDA, 2) Calculated on gross TTM finance cost
4,282 2,644 3,069 6,314 225 5,805 2019 2020 2021 2022 2023 2024 & Beyond
9 | EMAAR PROPERTIES
5.3% 6.6% 6.4% 10.2% EM Peers EU Peers US Peers Emaar Malls
1) Source: Factset, based on latest available Fiscal Year 2) Source: Factset, market valuation based on 15 th August 2019, * NAV taken as of 31st Dec, 2018
52.0 37.0 57%
2014 H1 2019
Market Cap (AED Bn) Premium / (Discount) to BV Premium / (Discount) to NAV* 3.9% 20.7% 13.2% 20.8% 20.0% MENA Peers Asian Peers UK Peers US Peers Emaar Properties 26.6% 22.6% 20.1% 11.4% 42.1% MENA Peers Asian Peers UK Peers US Peers Emaar Properties 0.44 1.45 0.03 0.70 0.36 MENA Peers Asian Peers UK Peers US Peers Emaar Properties
5-Year Revenue CAGR 1 EBITDA Margin % 1 Leverage – Debt / Equity 1 2019 Implied Cap Rate 2
Emaar Properties is Trading at Significant Discount to its NAV despite Superior Financial Metrics
2
10 | EMAAR PROPERTIES
11 | EMAAR PROPERTIES
Downtown Dubai Dubai Marina
2005 Today 2003 Today
✓ 500-acre Flagship Mega-Development ✓ One of the Most Visited Destinations In The World ✓ Includes World’s Tallest Building & World’s Largest Mall ✓ Largest Man-Made Marina1 (3.5 sq.km.) development of its kind ✓ Total development area of 66 million sq. ft. ✓ Includes c.0.4 mn sq. ft. Dubai Marina Mall
1) ArabianBusiness.com, 3 June 2015, “Dubai Marina, the region's largest marina development of its kind”
12 | EMAAR PROPERTIES
1) Revenue is based on incremental percentage of completion achieved on development as per IFRS 15, 2) Source: JLL
12.3 10.2 14.4 18.0 14.4 11.5 9.1 7.0 7.5 4.3 2014 2015 2016 2017 2018 Emaar Listed Peer 3.1 5.3 6.9 8.9 15.4 2014 2015 2016 2017 2018
Emaar’s Sales – Ahead of the Competition (More than 3x in 2018) Sustained Revenues1 (AED Bn) ✓ Displayed strong sales traction, despite difficult market conditions ✓ Significant long-term value creation through Integrated Master Developments centered around Iconic Assets ✓ Strong customer trust and brand loyalty ✓ ~38,864 residential units sold in last 10 years, recording sales of AED 101.5 Bn ✓ Emaar’s off-plan sales of c. AED 14.4 Bn in 2018, accounted for more than 65% of total off- plan sales (AED 21.4 Bn2) in Dubai
Emaar’s Unique Proposition of Integrated Masterplans and Superior Quality helped to Deliver Consistent Performance in UAE
In AED Bn
3,192 3,033 4,657 7,437 6,682 2014 2015 2016 2017 2018
Robust Sales Trend (Units)
13 | EMAAR PROPERTIES
The Dubai Mall – Most Visited Mall in the World
✓ World renowned shopping & entertainment destination ✓ 4.3 Mn sq. ft. GLA (incl. Fashion Avenue Expansion) ✓ 98% Leased, 95% Occupancy 1 ✓ 1,200+ stores with leading retailers and marquee global brands ✓ 83 Mn Footfalls in 2018 (4% CAGR over 2012-18)
1) As at 31 Dec 2018
14 | EMAAR PROPERTIES
✓ Preferred gateway to Dubai’s consumerism for aspiring retailers and brands ✓ Urban lifestyle destination and unique retail experience ✓ Benefits from mature catchment created by the integrated master community developments by Emaar ✓ Emaar’s malls are top choice for retailers in a difficult environment, due to our well-established presence, superior positioning and strong footfall
89 104 114 124 125 130 136 5,158 5,295 5,371 5,423 5,419 5,368 6,095 2012 2013 2014 2015 2016 2017 2018 Footfalls - Mn Main Units GLA - '000 Sq.Ft.
Robust Growth in Footfalls…
381 419 460 505 539 561 600 2012 2013 2014 2015 2016 2017 2018
Along with Steady Increase in Rent psf. (AED)
Emaar Malls Delivered Consistent Growth over 2012 to 2018
8% 7%
15 | EMAAR PROPERTIES
Emaar Malls Outperformed Dubai Retail Market over 2017-2018
1) Source: JLL
Super Regional Malls Regional Malls Specialty Retail & Community Centres
Rent per sq. ft.: 2-Yr CAGR Rent per sq. ft.: 2-Yr CAGR Rent per sq. ft.: 2-Yr CAGR 4%
2018 Emaar Dubai Retail Market 2%
2018 Emaar Dubai Retail Market
2018 Emaar Dubai Retail Market
1 1 1
16 | EMAAR PROPERTIES
899 991 1,195 1,389 1,291 1,304 62.6% 66.6% 67.7% 68.6% 58.7% 59.0% 2013 2014 2015 2016 2017 2018 Revenues EBITDA Margin %
Major Tourist Attractions driving Footfalls at The Dubai Mall ✓ At The Top, world’s highest observation desk ✓ Dubai Aquarium & Underwater Zoo featuring one of the world’s largest acrylic viewing panels ✓ VRZOO, VR experience of world’s endangered species ✓ KidZania, children’s edutainment centre ✓ Reel Cinemas, UAE’s largest 26-screen laser megaplex ✓ VR Park, largest virtual reality park spread
✓ Dubai Ice Rink, Olympic-sized ice-skating & events venue
Expansion Plans ✓ Planning to add new cinemas, family entertainment centres and thrill attractions in Dubai ✓ Focussing on expansion outside UAE, primarily in Saudi Arabia and Bahrain, to operate exceptional entertainment experiences
Entertainment Business: Robust Growth & Superior Margins
In AED Mn
17 | EMAAR PROPERTIES
1,515 1,681 1,677 1,438 1,520 1,559 30.8% 30.2% 23.9% 24.7% 25.5% 23.9% 2013 2014 2015 2016 2017 2018 Revenues EBITDA Margin %
Hospitality Business: Resilient & Profitable Emaar Hotels:
✓ Able to maintain healthy EBITDA margin in a weak market with operating costs under control ✓ Hospitality sector will be the key beneficiary of Expo 2020 (Emaar is also the Hospitality partner for Expo 2020) ✓ Adopting an asset-light strategy for growth ✓ Healthy pipeline of 30 hotels under development, 2/3rd of which are under management contracts ✓ Established brands – Address Hotels & Resorts, Vida Hotels & Resorts and Rove Hotels ✓ ADRs and Occupancy are higher than the average of Dubai’s market
In AED Mn
Steady Performance in a Difficult Market Environment
18 | EMAAR PROPERTIES
Retail
✓ Own & operate iconic retail assets ✓ Will be part of Emaar’s master developments ✓ Owns & operates one of the largest mall in Turkey
mn sq. ft. of GLA ✓ Uptown Cairo Mall - will be the largest open mall in Egypt ✓ Explore retail asset management contracts in UAE and GCC markets
Entertainment
✓ Launch entertainment avenues complementing
✓ Offer unique leisure attractions at Emaar Square Mall in Turkey - Discovery Centre, Aquarium & Underwater Zoo, Family Ent. Centre, Ice Skating Rink, Mega Movie Theatre ✓ Expansion outside UAE, primarily in Saudi Arabia and Bahrain
Hospitality
✓ Adopt an asset-light strategy to expand in key markets ✓ Leverage established brands – Address Hotels & Resorts, Vida Hotels & Resorts and Rove Hotels ✓ Currently, manage Al Alamein Hotel (4-star hotel with ~190 keys) in Marassi, Egypt
Leverage Emaar’s Strength And Unlock the Land Bank Potential in Key Markets
Development
✓ c. 34,500 units sold & c. 18,000 units delivered since 2002 ✓ 1.4 Bn sq. ft. land bank in key countries Major Projects: ✓ Egypt: Uptown Cairo - ‘City within a city’, Marassi - tourist resort with 7 distinct lifestyle districts ✓ Turkey: Emaar Square - mix-use development in the heart of Istanbul, Tuscan Valley - integrated community ✓ KSA: Jeddah Gate - integrated masterplan with premium residential ✓ India: world class living spaces in Gurugram, Delhi, Mohali, Jaipur, Indore etc.
19 | EMAAR PROPERTIES
20 | EMAAR PROPERTIES
21 | EMAAR PROPERTIES
Sustained Population Growth
population to grow at 3.4% from 2019-22 (vs. 2.7% in 2018)
GCC region, politically secure & conducive for business / investments
as the 4th Best Place to Work in the World
Dubai Economy Back on Recovery
Dubai economy is expected to grow at 3.0% in 2019 and 3.8% in 2020 1
Tourism Growth
Dubai’s economy
mn international passengers in 2018
15.9 mn international guests in 2018
influx of tourists from China (0.8 mn) & Russia (0.6 mn) in 2018
Positive Tailwinds
Additional 27,000 specialised jobs by 2030
make Dubai an international hub for knowledge-based industry
1) Source: Dubai Statistics Centre
22 | EMAAR PROPERTIES
Key Factors Affecting Residential Market Equilibrium
Supply Rationalisation
Demand Creation
flight
community lifestyle
ratio, rising mortgage contribution (18% in 2012 to 52% in 2018)
migration from neighbouring Emirates
Increased Affordability Investment Attractiveness
1) Source: www.globalpropertyguide.com, www.tradingeconomics.com, 2) As on Dec 2017
Affordability Index1 Price (USD/sqm.) Price / GDP Per Capita2 Mortgage Rate Rental Yield Price / Rent Dubai 5,918 8.8% 3.24% 5.19% 19x Sydney 10,711 24.0% 3.62% 2.52% 40x Mumbai 10,932 170.1% 8.60% 2.32% 43x Singapore 13,748 16.1% 1.85% 2.54% 39x New York 17,191 31.7% 3.27% 2.91% 34x Hong Kong 28,570 51.0% 2.15% 2.35% 42x London 29,676 74.7% 1.49% 2.71% 37x
USD 66,616 in 20181
real estate affordable
market currencies
23 | EMAAR PROPERTIES
master community developments to launch new projects
experience to discerning customers
Leverage the Strength
Millennials
larger community facilities
Product Innovations
customers
China, India, Saudi Arabia & other countries
Chinese customers
Marketing to International Customers
projects under development
flow generation
Well-planned Execution & Delivery
markets over longer term
cash outlay for land purchase)
dividend servicing, and to strengthen the balance sheet
Development Through JV/JDAs
1) Government Related Entities
24 | EMAAR PROPERTIES
regional malls, specialty retail, community retail centers
experiences
customer experience
retail centres
upcoming retail assets
contracts in Dubai & GCC region
markets, featuring 634 brands
tenants
Leverage Superior Asset Mix
Robust Retail Space Growth Strengthen Omni-channel Presence Quality & Profitability of Retail Assets
25 | EMAAR PROPERTIES
developments
(independently or through Joint Ventures)
construction with significant GLA already leased out Operate As Pure Rental Income Play
Projects under Emaar Malls Other Projects being developed by Emaar Properties
Project Name GLA (‘000 sq.ft.) Expected Opening Meadows Village
H2 2019 TDM Boulevard Expansion
H2 2020 Project Name GLA (‘000 sq.ft.) Expected Opening TDM - Fountain View Expansion c.169 Q3 2019 TDM - Zabeel Expansion c.150 Q3 2019 Emaar South Village1
Q4 2019 Dubai Hills Mall1 c.2,000 H1 2020 Dubai Expo Mall1,2 c.385 Q3 2020
1) Being developed under joint ventures by Emaar Properties & third parties, 2) Dubai South Mall is now renamed as Dubai Expo Mall
26 | EMAAR PROPERTIES
Emaar Properties (EP)
Cash Flow Generation
revenue Backlog)
entertainment, others) generate annual EBITDA of more than AED 1 Bn
asset light model and sale of other non-core commercial assets
to EM
Capital Allocation
Emaar Development (ED)
Cash Flow Generation
development
handover payment plan of completing projects
Capital Allocation
USD 1.7 Bn dividends over 2018-2020
Emaar Malls (EM)
Cash Flow Generation
assets and planned retail space expansion
Capital Allocation
(50-70% of FFO)
assets from EP
Focus on Sustained Dividend Payout in Future
27 | EMAAR PROPERTIES
28 | EMAAR PROPERTIES
Consolidated Results UAE Development International Development Emaar Malls Emaar Hospitality
Property Sales in UAE at AED 9.4 Bn +52% YoY Sales to International Customers grew 82% to AED 4 Bn Revenues AED 11.6 Bn EBITDA AED 4.9 Bn Net Profit AED 3.1 Bn 31% Recurring Revenues 46% Recurring EBITDA Emaar Malls Achieved 68 Mn Footfalls +3% YoY Emaar Malls1 Maintained 80%+ EBITDA Margin Entered into a JDA with Mina Rashid Properties LLC to develop Mina Rashid Land into Mixed Use Community
1) Excluding Namshi
29 | EMAAR PROPERTIES
Consolidated Results UAE Development International Development Emaar Malls Emaar Hospitality
1) 2018 figures are restated. Refer note 2.3 of the unaudited interim condensed financial statements for the period ended 30 June 2019 2) Comparative financial position numbers are as at 31 December 2018
AED Million Q2 2019 Q2 20181 % Change H1 2019 H1 2018 % Change Group Property Sales 4,379 2,481 77% 11,252 7,253 55% Revenue 5,675 6,113 (7%) 11,569 12,042 (4%) Gross Profit 2,713 3,135 (13%) 5,715 6,224 (3%) Margin (%) 47.8% 51.3% 49.4% 51.7% EBITDA 2,215 2,788 (21%) 4,911 5,390 (9%) Margin (%) 39.0% 45.6% 42.5% 44.8% Net Profit 1,369 1,606 (15%) 3,110 3,231 (4%) Margin (%) 24.1% 26.3% 26.9% 26.8% EPS (AED/Share) 0.19 0.22 (14%) 0.43 0.45 (4%) Total Equity2 59,713 56,789 5% 59,713 56,789 5% Cash2 7,790 9,494 (18%) 7,790 9,494 (18%) Debt2 22,339 20,910 7% 22,339 20,910 7% Net Debt2 14,549 11,416 27% 14,549 11,416 27%
30 | EMAAR PROPERTIES
6,979 6,281 1,550 1,743 2,066 2,161 797 678 650 706 H1 2018 H1 2019 UAE Development International Development Emaar Malls Emaar Hospitality Entertainment & Leasing 52% 2% 30% 6% 9% 1% 54% 15% 19% 6% 6%
Consolidated Results UAE Development International Development Emaar Malls Emaar Hospitality
12,042 11,569
+ 12% + 5%
+ 9% Segment Wise Revenues (AED Mn) Revenue Share % EBITDA Share %
Contribution From Recurring Business 31% Recurring Revenues 46% Recurring EBITDA
AED 11,569 Mn AED 4,911 Mn
Other Businesses
31 | EMAAR PROPERTIES
Consolidated Results UAE Development International Development Emaar Malls Emaar Hospitality
Revenues Gross Profit EBITDA Net Profit After Minority Interest
5,903 7,263 8,100 9,374 12,883 2014 2015 2016 2017 2018 4,636 5,783 6,676 7,763 10,827 2014 2015 2016 2017 2018 3,293 4,383 5,419 5,572 6,108 2014 2015 2016 2017 2018
CAGR 27% CAGR 22% CAGR 24% CAGR 17%
In AED Mn
Note: For 2014, results are based on completed contract method of revenue recognition
9,893 13,661 15,540 18,572 25,694 2014 2015 2016 2017 2018
32 | EMAAR PROPERTIES
Consolidated Results UAE Development International Development Emaar Malls Emaar Hospitality 16% 11% 13% 6% 1% 1% 44% 8%
LIABILITIES & EQUITY Trade & Other Payables Advances from Customers Interest Bearing Loans & Borrowings Sukuk Other Liabilities Liabilities Classified as Held for Sale Shareholder's Equity Non-Controlling Interests
Total: AED 116,276 Mn
Balance Sheet Overview
Assets Liabilities & Equity
Cash Flow Overview
In AED Mn 8,963 6,783 (1,489) 1,413 (2,184) 80
Dec-18 Cash & Cash Equivalents Operating CF Investing CF Financing CF FX Difference June-19 Cash & Cash Equivalents 7% 21% 35% 5% 18% 9% 1% 4% 1 Bank Balances & Cash Trade & Other Receivables Development Properties Loans & Investments in Associates & JVs Investment Properties Property, Plant & Equipment Assets Held for Sale Others
33 | EMAAR PROPERTIES
Consolidated Results UAE Development International Development Emaar Malls Emaar Hospitality
16 Projects Launched with a total value of c. AED 8.9 Bn in H1 2019
Under Construction
2019
To be recognized over next 3-4 years
Sales to International Customers grew 82% to AED 4 Bn
1) including 100% of Escrow balances of Joint Ventures & JDA’s, 2) Sales value of properties sold but not yet recognised as revenue under IFRS including 100% of joint ventures as of 30 June 2019, 3) Numbers excluding inter company transactions
3
AED Million Q2 2019 Q2 2018 % Change H1 2019 H1 2018 % Change Property Sales 3,335 2,323 44% 9,443 6,229 52% Revenue 2,897 3,726 (22%) 6,237 6,991 (11%) Gross Profit 1,174 1,671 (30%) 2,577 3,079 (16%) Margin (%) 40.5% 44.9% 41.3% 44.0% EBITDA 1,207 1,599 (25%) 2,530 2,842 (11%) Margin (%) 41.7% 42.9% 40.6% 40.7% Net Profit 864 1,483 (42%) 1,894 2,652 (29%) Margin (%) 29.8% 39.8% 30.4% 37.9%
34 | EMAAR PROPERTIES
Consolidated Results UAE Development International Development Emaar Malls Emaar Hospitality
# Based on launches till 30 June 2019 1) Sales value of units sold but not yet recognised as revenue under IFRS, including 100% ownership of joint ventures as of 30 June 2019 2) Based on units sold which are under development as at 30 June 2019, margin is not necessarily indicative of margin at completion 3) JVs/JDA numbers are on the basis of the full project and not proportional to Emaar’s share, while Emaar’s entitlement/share of profits is 50% 4) Emaar Beachfront launched in January 2018. In March 2018, an MOU with Aldar was signed to jointly develop the project; formal agreement is under process 5) Includes Arabian Ranches III 6) Not in the perimeter of Emaar Development PJSC
Others Downtown Dubai Arabian Ranches 5 Dubai Marina Emirates Living Emaar Beachfront 4 Lusaily 6 Dubai Hills Mina Rashid Dubai Creek 3 Emaar South 3 Ras Al Khaimah (100% owned land bank); Zabeel Square (JV with 60% share) 3 Total Units # 9,100 1,713 843 137 1,572 In Planning Stage 8,247 172 7,427 2,868 In Planning Stage 32,079 Area (Mn sq. ft.) # 11.7 2.7 0.9 0.2 1.6 In Planning Stage 13.2 0.2 7.5 3.8 In Planning Stage 41.8 Value (AED Bn) 32.2 2.8 1.9 0.4 4.2 In Planning Stage 20.0 0.3 14.1 3.6 In Planning Stage 79.6 % Units Sold 94% 91% 98% 99% 69% In Planning Stage 83% 37% 74% 83% In Planning Stage 84% % Value Sold 88% 89% 97% 99% 63% In Planning Stage 88% 37% 67% 78% In Planning Stage 83% % Collected of sold units 45% 16% 52% 84% 20% In Planning Stage 46% 7% 28% 27% In Planning Stage 41% Revenue Backlog 1 16.4 2.5 1.0 0.0 2.7 In Planning Stage 6.0 0.1 7.0 1.9 In Planning Stage 37.8 Gross Margin Achieved 2 41% 30% 37% 29% 32% In Planning Stage 47% 33% 30% 29% In Planning Stage 39% Total Remaining GFA (Million Sqf) 2.4 16.3
7.4 96.0 55.0 11.3 101.3 30.1 3.5 323.5 Remaining GFA of Build-to-Lease (BTL) / Build-to-Operate (BTO)(@) (Million Sqf) 0.5 0.1
0.7 0.0 13.7 0.2 24.3 3.0 0.4 43.0 Remaining GFA of Build-to-Sale (BTS) (Million Sqf) 2.0 16.2
6.7 96.0 41.3 11.1 77.0 27.1 3.1 280.5 100% Owned Developments JV/JDAs with 50% Share 100% Consolidated JV Remaining GFA to be launched in future (*)
35 | EMAAR PROPERTIES
Consolidated Results UAE Development International Development Emaar Malls Emaar Hospitality
3,140 5,253 6,899 8,863 15,433 2014 2015 2016 2017 2018 1,841 2,395 2,861 3,761 6,700 2014 2015 2016 2017 2018 1,507 1,918 2,353 3,236 5,657 2014 2015 2016 2017 2018 1,611 1,962 2,452 2,743 3,901 2014 2015 2016 2017 2018
Revenues Gross Profit EBITDA Net Profit After Minority Interest
CAGR 49% CAGR 38% CAGR 39% CAGR 25%
In AED Mn
Note: Revenue is based on incremental percentage of completion achieved on development as per IFRS 15
36 | EMAAR PROPERTIES
Consolidated Results UAE Development International Development Emaar Malls Emaar Hospitality
Projects Launched in H1 2019 with a total value of
Under Construction
in H1 2019
Revenue Backlog 1
To be recognized over next 3-4 years
Delivered in H1 2019
Sold Since Inception
Delivered Since Inception
International Sales – Units Released
1) Sales value of properties sold but not yet recognised as revenue under IFRS as of 30 June 2019
% Sold of Units Released
37 | EMAAR PROPERTIES
Consolidated Results UAE Development International Development Emaar Malls Emaar Hospitality
Emaar Misr – Development 1
1) Emaar Misr for Development is an EGX-listed company developing residential & commercial projects in Egypt. Emaar Misr financial information provided above is based on the accounting policies adopted by the Group. Exchange rates used for June 2019 is AED 0.2123 per EGP.
Key Highlights
H1 FY 2019
AED 7.0 Bn at the end of 30 June 2019
Emaar Misr Positioned Itself As Local Market Leader Delivering Superior Growth
H1 2019 Revenue Breakup
49% 21% 30% Villas Townhouses Apartment H1 2019 H1 2018 % Change H1 2019 H1 2018 % Change Units Delivered 301 437 (31%) 301 437 (31%) Net Sales 1,160 802 45% 5,465 3,871 41% Revenue 726 432 68% 3,420 2,085 64% EBITDA 78 180 (57%) 366 869 (58%) Margin(%) 10.7% 41.7% 10.7% 41.7% Net Profit 169 294 (43%) 798 1,420 (44%) Margin(%) 23.3% 68.1% 23.3% 68.1% AED Million EGP Million
38 | EMAAR PROPERTIES
Consolidated Results UAE Development International Development Emaar Malls Emaar Hospitality
1) Transaction after inter company adjustment and including Namshi
Emaar Malls (Excl. Namshi) Key Highlights
compared to H1 2018
brands, received strong customer response during Dubai Shopping Festival, Chinese New Year and Spring Fashion campaign
accelerating digital strategy
AED Million Q2 2019 Q2 2018 % Change H1 2019 H1 2018 % Change Revenue 1,122 1,045 7% 2,161 2,066 5% Gross Profit 865 819 6% 1,717 1,636 5% Margin (%) 77.1% 78.4% 79.5% 79.2% EBITDA 730 751 (3%) 1,466 1,468 (0%) Margin (%) 65.1% 71.9% 67.8% 71.0% Net Profit 488 504 (3%) 996 981 2% Margin (%) 43.5% 48.2% 46.1% 47.5%
AED Million H1 2019 H1 2018 % Change GLA (Mn sq. ft.) 6.7 6.7 0% Occupancy Rate (%) 90% 88% Base Rent 1,351 1,292 5% Turnover Rent 49 61 (20%) Revenue 1,806 1,720 5% EBITDA 1,451 1,443 1% Margin (%) 80.3% 83.9%
39 | EMAAR PROPERTIES
Consolidated Results UAE Development International Development Emaar Malls Emaar Hospitality
Rental Income EBITDA
In AED Mn
CAGR 8% CAGR 10%
Net Profit
CAGR 14%
2,694 2,992 3,227 3,323 3,599 2014 2015 2016 2017 2018 2,018 2,250 2,447 2,676 2,934 2014 2015 2016 2017 2018 1,351 1,656 1,874 2,092 2,281 2014 2015 2016 2017 2018
40 | EMAAR PROPERTIES
Consolidated Results UAE Development International Development Emaar Malls Emaar Hospitality
1) Included in Emaar Malls Financial Results starting from 16 August 2017, 2) Defined as having shopped in 2018
Namshi Revenues 1 (AED Mn)
CAGR 50%
Net Merchandise Value + 17% Online Traffic + 9% Gross Profit + 5% Active Customers2 + 26% Social Media Engagement + 22% Number of Orders + 20%
167 440 555 730 849 2014 2015 2016 2017 2018
41 | EMAAR PROPERTIES
Consolidated Results UAE Development International Development Emaar Malls Emaar Hospitality
Key Highlights H1 FY 2019 Revenue Breakup
(*): Refers to the hotels in Dubai only (excluding Armani & Rove Hotels) (1) EBITDA includes profit on sale of 5 hotels
Emaar Hospitality Resilient, Outperforming the Broader Hospitality Market in UAE
and Occupancy
Trip Advisor
sale of 5 hotels
Room Revenue 42% F&B Revenue 32% Rental Pool & Others 26%
AED Million H1 2019 H1 2018 % Change Occupancy Rate (%)* 74% 76% RevPar (AED)* 820 856 (4%) Room Revenue 282 350 (19%) F&B & Other Revenue 396 447 (11%) Total Revenue 678 797 (15%) EBITDA1 317 215 47% Margin (%) 46.8% 27.0%
42 | EMAAR PROPERTIES
Consolidated Results UAE Development International Development Emaar Malls Emaar Hospitality
1) These hotels have been sold as a part of Asset Light Strategy, and will now be operated by Emaar under long term Hotel Management Agreement
H1 2019 H1 2018 H1 2019 H1 2018 H1 2019 H1 2018 Available Room Nights 35,476 35,476 43,802 43,802 44,164 44,164 Occupancy (%) 67% 74% 77% 80% 79% 68% ADR (AED) 1,344 1,420 1,312 1,469 1,223 1,362 RevPar (AED) 907 1,053 1,010 1,175 965 926 Room Revenue (AED Thousands) 32,194 37,357 44,233 51,447 42,631 40,885 H1 2019 H1 2018 H1 2019 H1 2018 H1 2019 H1 2018 Available Room Nights 36,200 36,200 35,657 35,657 28,236 28,236 Occupancy (%) 82% 84% 77% 77% 78% 81% ADR (AED) 849 938 647 745 669 786 RevPar (AED) 699 784 499 573 524 635 Room Revenue (AED Thousands) 25,312 28,370 17,801 20,418 14,806 17,936 Address Boulevard1 The Palace Downtown Address Dubai Mall1 Address Dubai Marina1 Manzil Downtown1 Vida Downtown1
43 | EMAAR PROPERTIES
44 | EMAAR PROPERTIES
UAE Development
developer in Dubai
delivered since 2002
construction substantially sold (~84% - June-19)
Bank in the UAE
business is led by Emaar Development PJSC, listed
2017
International Operations
growth countries
partners
delivered since 2006
level of 87%
Bank in key countries
the Egyptian Exchange since July 2015
Mall at Turkey with 1.6 mn
Emaar Malls
listed on DFM since October 2014
most visited mall in the world, The Dubai Mall
properties in Dubai
Emaar Hospitality
(21 hotels with 4,679 keys) (includes owned as well as managed assets)
Armani and Manzil brands.
segment under Rove Hotels (JV with Meraas)
Dubai’s iconic cultural destination ‘’Dubai Opera’’
portfolio (includes both in
development hotels)
Entertainment & Leasing
entertainment and manager of leisure assets
Aquarium, Underwater Zoo, Reel Cinemas, KidZania, VR Park, Dubai Ice Rink and At The Top.
commercial properties in Dubai
45 | EMAAR PROPERTIES
Arabian Ranches
Expansion of the current Arabian Ranches community adjacent to a golf course and in close proximity to the Dubai Polo & Equestrian Club to create over 1,400 additional units
Dubai Marina
Two waterfront residential/commercial towers, near to Bluewaters Island, and the newly- developed Vida serviced apartments tower
Downtown Dubai
All under-construction projects (including Sky Views, BLVD Heights, Fountain Views, Boulevard Point, Vida Residence, Downtown Views, and Grande), inventory and undeveloped land for sale
Wholly-owned projects Emirates Living
Green-focused development featuring two low-rise apartment buildings that
Club and a two-tower mixed- use development
Emaar Beachfront *
An exclusive residential community within the new maritime epicentre of the UAE, Dubai Harbour. The development represents a unique blend of cosmopolitan living in a prime location and a serene seaside lifestyle.
Land bank (100% owned) Al Marjan - Ras Al Khaimah
A project of c.1m sqft of land located at the top of Al Marjan Island ideal to build 5 stars hotel and service apartments A contiguous land parcel of 46m sqft subdivided into two plots located between Dubai Investment Park and Jumeirah Golf Estates in Dubai
Lusaily
*Emaar Beachfront partial acquisition completed and launched in Jan 2018. In March 2018 an MOU with Aldar was signed to jointly develop the project; formal agreement is under process
46 | EMAAR PROPERTIES
100% Consolidated JV Dubai Creek Harbour
Joint Venture between Emaar and Dubai Holding for the development of an iconic mixed- use waterfront project situated
Dubai Creek
Emaar South
Joint Venture between Emaar and Dubai Aviation City Corporation that is part of 145 sqkm smart city set to become a pivotal hub in the global economy, located within Emirates’ flagship urban project, Dubai South
Dubai Hills Estate
Joint Venture between Emaar and Meraas Holding to create a mixed-use development with a series of unique neighbourhoods set around an 18-hole championship golf course
Zabeel Square
Joint venture between Emaar and Meraas to create a mixed- use development near Zabeel Park, Dubai
JVs/JDAs with 50% share Mina Rashid
Joint Venture between Emaar and Mina Rashid Properties LLC to develop Mina Rashid land into a mixed-use community as per the master plan. It will be known as world’s new sailing destination set by historic Dubai Creek
47 | EMAAR PROPERTIES
1) Total monetary value of units under development based on expected selling price 2) Corresponds to gross margin for units sold not necessarily indicative of margin at completion Note: Revenues of project under construction are recognized once 20% construction completion and 20% collection is achieved *Projects launched in phases 3) Emaar Beachfront launched in Jan 2018, in March 2018 an MOU with Aldar was signed to jointly develop the project; formal agreement is under process # ED’s percentage of share is 61.25%
Project (100% Owned) Units Amount (AED) (1) Area (SQF) Launched Period % Unit Sold % Value Sold % Collected of sold units % Completion Jun.19 % Gross Margin Jun19 (2) Downtown Dubai 9,100 32,150,382,295 11,685,224 94% 88% 45% 41% Fountain Views 2 289 1,102,878,520 392,485 Feb-13 100% 100% 84% 99% 28% Fountain Views 3 208 1,143,521,704 356,367 Sep-13 98% 97% 85% 99% 31% The Address Sky View 551 2,889,415,978 984,654 2013-2014 100% 100% 80% 96% 30% Blvd Heights * 550 1,767,641,725 773,089 Sep-14/ Mar-16 86% 81% 69% 90% 50% Vida Downtown 344 1,400,262,008 492,618 Jan-14 92% 88% 75% 99% 42% Grande 882 2,768,162,461 958,989 May-18 72% 61% 14% 0% 50% Boulevard Point 449 1,361,974,590 592,675 Jan-14 100% 99% 74% 86% 25% Opera Grand Residential Tower 295 2,108,059,793 519,480 May-14 90% 86% 57% 70% 59% The Downtown Views 478 1,230,953,464 573,081 Apr-15 100% 99% 49% 44% 44% FORTE 919 2,595,089,129 1,064,212 Apr-Sep-15 95% 93% 40% 37% 35% Address Opera 809 3,833,303,848 1,093,771 Dec-15/ Mar-16 97% 85% 34% 30% 48% IL PRIMO 119 2,641,243,081 701,836 Jun-16 61% 63% 22% 36% 42% Act One Act Two 630 1,660,716,912 656,678 Aug-16 100% 100% 30% 27% 39% Downtown Views 2 1,355 3,039,804,240 1,425,583 Jan-Apr-17 100% 100% 30% 16% 33% Vida Dubai Mall 620 1,625,816,560 606,860 May-Jul-17 100% 99% 25% 7% 41% Burj Royale # 602 981,538,282 492,846 Jan-18 99% 99% 13%
Emirates Living 137 422,008,656 202,837 99% 99% 84% 29% Vida Residence - The Hills 137 422,008,656 202,837 Dec-13 99% 99% 84% 99% 29% Dubai Marina 843 1,909,388,584 923,570 98% 97% 52% 37% 52-42 483 1,087,626,904 515,866 Apr-16 97% 96% 64% 76% 39% Vida Residence at Dubai Marina 360 821,761,680 407,704 Mar-17 98% 97% 36% 27% 34% Arabian Ranches II 642 1,180,188,618 1,052,342 100% 100% 23% 41% Reem Community 216 505,157,330 398,804 Dec-16 100% 99% 36% 91% 47% Camelia 258 407,399,104 395,658 Oct-18 100% 100% 14% 1% 35% Camelia 2 168 267,632,184 257,880 Oct-18 100% 100% 14% 0% 39% Arabian Ranches III 1,071 1,593,912,960 1,615,892 82% 79% 10% 22% Sun 431 622,851,384 643,125 Feb-19 92% 92% 11%
Joy 486 735,662,568 740,435 Mar-19 76% 72% 10%
Spring 154 235,399,008 232,332 May-19 71% 67% 6%
Emaar Beachfront3 1,572 4,244,708,803 1,648,013 69% 63% 20% 32% Beach Vista 445 1,182,163,160 471,634 Jan-18 97% 95% 26% 14% 26% Sunrise Bay 457 1,209,306,278 470,456 Feb-18 71% 61% 20% 14% 33% Marina Vista 346 788,943,248 315,482 Sep-18 64% 56% 13% 4% 33% Grand Bleu Tower 324 1,064,296,117 390,441 Apr-19 35% 34% 11%
Total 100% Owned 13,365 41,500,589,916 17,127,878 91% 86% 39%
48 | EMAAR PROPERTIES
1) Total monetary value of units under development based on expected selling price 2) Corresponds to gross margin for units sold not necessarily indicative of margin at completion Note: Revenues of project under construction are recognized once 20% construction completion and 20% collection is achieved 3) Dubai Hills Estates does not include land plots available for sale
Project (Joint Ventures) Units Amount (AED) (1) Area (SQF) Launched Period % Unit Sold % Value Sold % Collected of sold units % Completion Jun.19 % Gross Margin June.19 (2) Dubai Hills Estates (3) 8,247 20,034,556,557 13,196,750 83% 88% 46% 47% Acacia Park Heights 537 1,058,240,812 677,047 Feb-15 89% 87% 54% 98% 38% Maple 646 1,752,057,769 1,215,738 Apr-15 99% 99% 62% 99% 51% Maple 2 666 1,735,205,408 1,229,258 Oct-15 99% 99% 57% 99% 49% Sidra 479 2,026,727,352 1,303,633 Feb-16 100% 100% 50% 99% 45% Fairway Vista 65 986,022,720 502,931 May-16 98% 99% 47% 99% 59% Parkway Vistas 61 868,835,168 466,172 Aug-16 100% 100% 43% 99% 58% Park Point 333 483,285,704 331,171 Oct-16 74% 65% 33% 61% 36% Sidra 2 422 1,736,090,551 1,127,673 Oct-16 99% 99% 45% 98% 47% Park Heights I 270 314,049,760 216,135 Apr-17 93% 88% 35% 68% 35% Park Heights II 555 645,013,840 442,933 May-17 92% 87% 34% 72% 38% Maple 3 562 1,472,026,835 1,029,810 May-17 99% 99% 43% 76% 49% Park Ridge 492 693,125,802 422,330 Sep-17 77% 66% 22% 28% 42% Sidra 3 339 1,345,541,032 881,928 Jul-17 100% 100% 42% 54% 47% Club Villas 144 545,290,872 351,500 Nov-17 100% 100% 22% 36% 54% Golf Place 134 1,255,832,992 995,384 Jan-18 93% 96% 20% 10% 54% Collective 473 408,345,024 274,790 Mar-18 100% 100% 27% 4% 38% Socio 332 277,745,460 193,826 Feb-18 100% 100% 20% 24% 36% Collective 2 494 438,867,672 285,010 Sep-18 49% 46% 14% 4% 35% Golf Suites 211 337,870,368 202,994 Nov-18 49% 45% 22%
Executive Residences 562 804,068,056 463,277 Jan-19 27% 25% 10%
Golf Grove 164 552,960,632 400,007 Feb-19 38% 39% 18%
Golfville 306 297,352,728 183,203 Apr-19 36% 33% 7%
Mina Rashid 172 338,898,736 175,819 37% 37% 7% 33% Sirdhana 172 338,898,736 175,819 May-19 37% 37% 7%
49 | EMAAR PROPERTIES
1) Total monetary value of units under development based on expected selling price 2) Corresponds to gross margin for units sold not necessarily indicative of margin at completion Note: Revenues of project under construction are recognized once 20% construction completion and 20% collection is achieved
Project (Joint Ventures) Units Amount (AED) (1) Area (SQF) Launched Period % Unit Sold % Value Sold % Collected of sold units % Completion Jun.19 % Gross Margin Jun19 (2) Dubai Creek Harbour 7,427 14,109,703,283 7,491,085 74% 67% 28% 30% Creekside 18 442 882,717,496 491,454 Sep-15 87% 73% 43% 82% 21% Harbour Views 748 1,417,240,224 799,019 Sep-15/ Mar-16 92% 83% 57% 82% 34% Creek Horizon 509 969,640,992 555,117 Aug-16 72% 61% 35% 60% 29% Creek Gate 490 926,883,120 528,287 Jan-17 75% 66% 28% 52% 30% Harbour Gate 513 917,705,544 527,348 Feb-17 69% 57% 27% 43% 27% The Cove 276 693,645,599 339,647 Mar-17 71% 65% 34% 46% 33% Creek Rise 496 865,133,072 496,964 May-17 73% 64% 24% 48% 26% 17 Icon Bay 326 578,215,488 327,933 Aug-17 83% 71% 23% 12% 32% Address Harbour Point 800 2,155,534,111 843,064 Sep-17 72% 64% 22% 11% 36% Breeze 202 333,442,376 192,487 Oct-18 96% 92% 12% 0% 31% Sunset 144 233,713,346 138,174 Nov-18 94% 91% 13%
The Grand 559 1,222,512,392 601,295 Mar-18 86% 87% 25% 10% 33% Palace DCH 587 1,026,788,256 540,047 Jan-19 88% 79% 9%
Bay Shore 304 347,400,952 230,308 Feb-19 67% 63% 9%
Summer 300 364,717,400 232,570 Apr-19 71% 65% 6%
Creek Edge 563 969,389,944 515,847 May-19 24% 22% 6%
Surf 168 205,022,971 131,524 Jun-19 42% 41% 4%
Emaar South 2,868 3,600,264,228 3,826,520 83% 78% 27% 29% Urbana I, II, III * 932 1,012,238,858 1,065,804 Sep-16/ Apr-17 74% 72% 46% 95% 32% Golf Views 288 300,394,744 253,035 Feb-17 72% 64% 45% 90% 16% Golf links 204 563,640,798 460,544 Jul-17 36% 35% 26% 67% 41% Parkside 371 438,455,004 509,243 Oct-18 99% 99% 9%
Parkside 2 422 503,679,736 604,920 Jan-19 99% 99% 9%
Parkside 3 365 434,191,120 519,318 Feb-19 97% 96% 9%
Green View 286 347,663,968 413,656 Apr-19 94% 93% 9%
Grand Total (100% Owned + JVs) 32,079 79,584,012,720 41,818,052 84% 83% 41% 39%
50 | EMAAR PROPERTIES
Emaar Beachfront(1)
(1) Emaar Beachfront partial acquisition completed and launched in Jan 2018. In March 2018 an MOU with Aldar was signed to jointly develop the project; formal agreement is under process (2) Not in the perimeter of Emaar Development PJSC
Arabian Ranches I & II Mina Rashid
Lusaily(2)
Arabian Ranches III
51 | EMAAR PROPERTIES
Completed Under Development Under Development Delivery Schedule Already delivered in 2019 2019 2020 2021 2022 2023
Downtown 11,723 9,100 646 2,391 773 3,832 2,104
Dubai Marina 4,450 843
360
4,360
1,022 642 108 216
640
14,831 137 426 137
168
732 8,247 676 2,876 3,027 2,133 211
277
37,563 21,784 1,856 5,620 4,283 8,430 3,127 324 B - Joint Ventures Dubai Creek Harbour 872 7,427 872
976 2,977
371 1,073
872 10,295 872
1,347 4,050
38,435 32,079 2,728 5,620 9,181 9,777 7,177 324
52 | EMAAR PROPERTIES
*Emaar Beachfront partial acquisition completed and launched in Jan 2018. In March 2018 an MOU with Aldar was signed to jointly develop the project; formal agreement is under process
No Long Term Need for Land Purchase
Note: Cumulative historical GFA BTS not adjusted for GFA developed post 2011 nor GFA currently under development
Land Bank Evolution Though Investments & Strategic Partners Year Area 2012 Arabian Ranches II 2013 Dubai Hills Estate 2014 Dubai Creek Harbour 2015 Emaar South 2016 Downtown Views, Ras Al Khaimah 2017 Zabeel Square & Emaar Beachfront* 2019 Arabian Ranches III & Mina Rashid
(million sq ft)
GFA BTS Gross Land Area BTS
+50%
CAGR
20x
Multiple GFA BTS 2011-H1 2019 # Not in the perimeter of Emaar Development PJSC,
13 18 78 167 198 199 211 211 240 9 25 114 162 231 233 234 234 267 2011 2012 2013 2014 2015 2016 2017 2018 H1 2019
Gross Land Area (Million SQFT) UAE wholly owned
69.30 Lusaily # 45.98 Ras Al Khaima 0.84 Others (Downtown, Arabian Ranches etc.) 21.81 Emaar Beachfront 0.67
Dubai Hills
52.08
Dubai Creek
54.97
Mina Rashid
10.11
Emaar South & others
60.61
Total UAE Available Land Bank
247.07
UAE Available Land Bank
53 | EMAAR PROPERTIES
Country Entity Completed Under Development To be developed Cumulative till Jun 2019 2019 2020 2021 2022 2023 Subsidiaries Emaar Misr 6,514 7,030 7,875 6,484 782 1,649 1,209 1,431 3,710 Emaar Middle East 927
260 113
985 320
88 374 63
Renaissance 401 159 75 373 57 52 81 35 37 EGKL & EDIL 603 1,114 759 334 581 1,502 55 4
11,684 6,043 5,581 10,666 950 4,626 4,150 1,867 1,049 Total 21,114 14,666 14,290 19,191 2,718 8,316 5,558 3,337 4,796
54 | EMAAR PROPERTIES
Gross Land Area (Million SQFT) Saudi Arabia (Emaar Economic City)
1,117.05
Saudi Arabia (Emaar Middle East)
34.58
India (Emaar MGF)
146.92
Egypt
48.89
Pakistan
16.22
Turkey
6.08
Lebanon
3.42
Total Key International Markets
1,373.16
International Land Bank
55 | EMAAR PROPERTIES
Accounting P&L Balance Sheet Impact on Return on Capital Dubai Hills – Consolidation
Mina Rashid – Consolidation
Dubai Creek BTS projects – JDA
management fee in revenue BTL/BTO projects –
equity method
development agreements
joint ventures
ventures
Assets not recognised on company’s Balance Sheet Emaar South & Zabeel Square – Equity Method BTS projects –
revenue of Emaar Development.
joint ventures
ventures
Assets not recognised on company’s Balance Sheet
56 | EMAAR PROPERTIES
1) Rove is joint venture with Meraas Holding 2) TAH&R: The Address Hotels and Resorts 3) Formerly Al Manzil Hotel; reopened after renovation on December 15, 2014 4) Formerly Qamardeen Hotel; reopened after renovation on June 16, 2013 5) Emaar maintains management rights only; disposed ownership on June 7, 2012 6) Residences in the Hotel Pool are operated by Emaar Hospitality like hotel rooms, on behalf of unit owners, for a % of reve nue 7) Other Emaar Group Hotels are not operated by Emaar Hospitality Group 8) Al Alamein Hotel includes 187 rooms and 2 villas 9) Al Alamein Hotel is a landmark Egyptian hotel operating since 1964 and acquired by Emaar in 2007 10) Emaar maintains management rights as per hotel management agreement, disposed ownership to Abu Dhabi National Hotels on 12 Feb 2019 Armani Hotel - Dubai 5 Star 160 23 2010 TAH&R(2) 5 Star 220 193 2008 TAH&R(2) 5 Star 244 256 2009 TAH&R(2) 5 Star 200 34 2009 TAH&R(2) Standard 22 NA 2006 TAH&R(2) 5 Star 196 NA 2017 TAH&R(2) 5 Star 242 NA 2007 Vida Hotels & Resorts 4 Star 197 NA 2007 Vida Hotels & Resorts 4 Star 156 NA 2007 Vida Hotels & Resorts 4 Star 160 NA 2019 Emaar Hospitality Standard 11 NA 2007 Nuran Standard 90 NA 2006 ROVE (1) 3 Star 420 NA 2016 ROVE (1) 3 Star 270 NA 2016 ROVE (1) 3 Star 286 NA 2017 ROVE (1) 3 Star 270 NA 2017 Rove Dubai Marina ROVE (1) 3 Star 384 NA 2018 Rove At The Parks ROVE (1) 3 Star 579 NA 2019 Armani Hotel-Milan 5 Star 95 2011 Accor 5 Star 288 NA 2006 TAH&R(2) 4 Star 187 + 2(8) NA
(9) 2007
Emaar India 4 Star 90 NA 2017 Address Boulevard10 The Palace Downtown Dubai Manzil Downtown Dubai3 & 10 Vida Downtown Dubai4 & 10 Novotel (Hyderabad, India) Arabian Ranches Golf Club Nuran Marina Residences5 Rove Downtown Rove City Center Rove Healthcare City International Armani Hotel at Via Manzoni (Milan, Italy) Other Emaar Group Hotels (7) International Rove Trade Center Al Alamein Hotel (Marassi, Egypt) Fortune Hotel Operational Hotel Management Company Classification Keys Residences in Hotel Pool(6) Vida Hills Hotel & Residences Emaar Hospitality Group Hotel Portfolio Dubai Armani Hotel at Burj Khalifa Address Downtown Dubai Address Dubai Mall10 Address Dubai Marina10 Address Montgomerie Dubai
57 | EMAAR PROPERTIES
1) The Serviced Apartments figures refer to the total number of apartments and not the units in the hotel pool 2) Portion of rooms keys are sold to customers on hotel management agreement basis
Hotel Location Launch Keys Serviced Apartments1 Estimated Completion Vida Residences Downtown 2013 NA 344 2019 Address Sky View Downtown 2013 169 551 2019 Address Fountain Views Downtown 2013 194 786 2019 Rove South Emaar South 2017 532 77 2020 Rove at DWTC DWTC, Dubai South 2017 506 NA 2020 Vida Dubai Marina Dubai Marina 2017 158 360 2020 Vida Dubai Mall Downtown 2017 195 380 2021 Vida Island District DCH 2017 286 NA 2019 Rove La Mer La Mer District 2018 366 NA 2020 Rove City Walk City Walk 2018 566 2 NA 2021
58 | EMAAR PROPERTIES
Fair valuation is carried out by CBRE, DTZ and other reputable valuers for development properties (including land), investmen t properties and revenue generating fixed
Market Value of Assets is 1.7x of the Book Value
59 | EMAAR PROPERTIES
Fair valuation is carried out by CBRE, DTZ and other reputable valuers for development properties (including land), investmen t properties and revenue generating fixed
AED Million Book Value Fair Value Book Value Fair Value AED Million Book Value Fair Value Book Value Fair Value UAE 20,067 39,748 16,787 36,819 Egypt 2,024 6,428 1,919 6,753 Turkey 1,260 1,662 1,291 1,846 India 11,640 15,101 13,280 17,299 KSA 790 850 751 889 District Cooling Plant 749 749 792 792 Pakistan 862 2,472 946 2,782 At The Top 247 247 182 182 USA 744 744 735 736 Lebanon 622 1,084 586 1,064 Morocco 319 582 368 628 Syria 56 56 58 57 Total 38,384 68,727 36,721 68,873 Total 10,648 12,566 11,237 14,590 7,442 Hotels, Convention Center & Serviced Apartments GAV: Development Properties GAV: Fixed Assets 2018 2017 2018 2017 5,811 5,480 3,058 4,880 4,200 5,480 Emaar Business Park 29 135 32 143 Leisure, Entertainment & Medical Center 744 744 551 551 Other Assets (Self Occupied, CWIP, Sales Center) 5,821
60 | EMAAR PROPERTIES
Fair valuation is carried out by CBRE, DTZ and other reputable valuers for development properties (including land), investmen t properties and revenue generating fixed
Book Value Fair Value Book Value Fair Value Cash and bank balances 9,494 9,494 21,103 21,103 Trade and Other Receivables 21,977 21,977 13,949 13,949 Development Properties 38,384 68,727 36,721 68,873 Investment in Associates and Joint Ventures 4,701 3,975 4,723 5,802 Securities and Loans to Associates and Joint Ventures 3,223 3,223 2,713 2,713 Investment Properties 19,768 66,698 16,596 64,626 Fixed Assets 10,648 12,566 11,237 14,590 Intangible assets 616 616 627 627 Assets Held for sale 3,144 3,144 5,968 5,968 Total Assets 111,955 190,420 113,637 198,251 Total Liabilities (incl. Minority Interest) (63,422) (81,824) (65,680) (85,280) Net Asset Value 48,533 108,596 47,957 112,971 Number of Shares Outstanding (in Million) 7,160 7,160 7,160 7,160 Net Asset Value per Share (AED) 6.78 15.17 6.70 15.78 2018 2017
61 | EMAAR PROPERTIES
(3) (3)
62 | EMAAR PROPERTIES
EMAAR PROPERTIES
Name – Abhay Singhvi Email id - ASinghvi@emaar.ae
DICKENSON IR
Name – Mehul Mehta / Aakash Mehta Email id – emaar@dickensonworld.com