SLIDE 1 Comparison Between Surface Melt Days Estimation from a Regional Climate Model and Near-Daily Synthetic Aperture Radar Backscattering
SLIDE 2
The methodology is applied in Dronning Maud Land – East Antarctica, but is also applicable elsewhere
SLIDE 3 [E. Rignot et al., 2019]
Antarctica is losing mass at an increasing rate, and requires a monitoring of its key variables such as surface melt
1980-1990 : -40 Gt/a 1990-2000 : -50 Gt/a 2000-2010 : -144 Gt/a 2010-2020 : -252 Gt/a → 6x more loss is 30 years
SLIDE 4
The Regional Climate Model (MAR) is able to model the surface melt in Antarctica
SLIDE 5
Using time series on the entire continent, we can compute the whole ice melt coverage
SLIDE 6
These models constitute predictions based on our current knowledge of the geophysics and need to be verified
→ This is now possible with Remote Sensing using the very high revisit rate of current satellites
SLIDE 7 SAR is an imaging technique where a spaceborne sensor emits an electromagnetic wave and captures its return
[Copernicus, 2019]
SLIDE 8 SAR Remote Sensing is independent of the Sun’s Illumination, which allows to work day-and-night, crucial in polar regions
Optical Image SAR Image [De Luca, C. 2017]
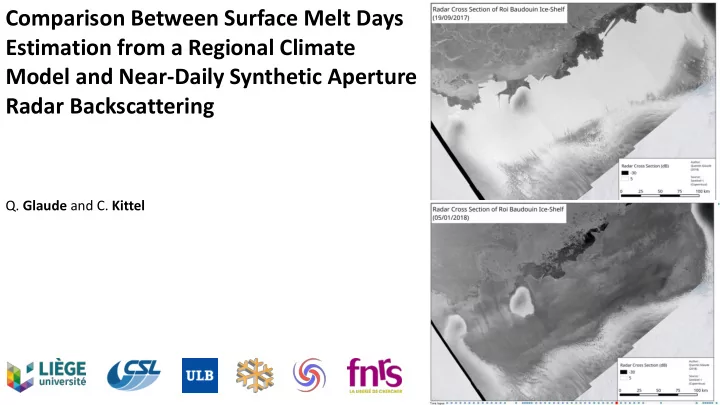
SLIDE 9 Surface melt can be observed using Radar Backscattering / Radar Cross Section (through changes of the dielectric constant)
Melting period : → strong decrease in radar cross section
SLIDE 10 Using time series on a given region, we can observe melt periods at very high spatial resolution and time
Play button →
SLIDE 11
Time series analysis of Radar Cross Section (RCS) allows the estimation of melt days per year and pear region
SLIDE 12
Preliminary results show a strong correlation between the RCS and the predicted surface melt from MAR
SLIDE 13
RCS is also correlated to rainfalls, since backscattering is impacted by surface moisture
SLIDE 14
Similarly, there is a net correlation between RCS and water content (1st meter)
SLIDE 15
There is a positive correlation between RCS and albedo, although RCS is less variable
SLIDE 16
There is a low negative correlation between Radar Cross Section (RCS) and snowfall (less snowfall in melt periods)
SLIDE 17 To conclude, preliminary analysis compares SAR observations with MAR predictions. End goal of the project is to refine MAR by analyzing prediction anomalies
- 1. Statistical analysis : What is the difference between the number of melt days predicted by
MAR and observed by SAR ?
- 2. Geospatial analysis : Where are located the differences between MAR and SAR? How is the
spatial distribution of these residuals ? Can they be linked to geophysical elements ?
- 3. Time series analysis : When are the differences between MAR and SAR occurring ?