
SLIDE 1
Erosion Mechanisms and the Revised Universal Soil Loss Equation - - PowerPoint PPT Presentation
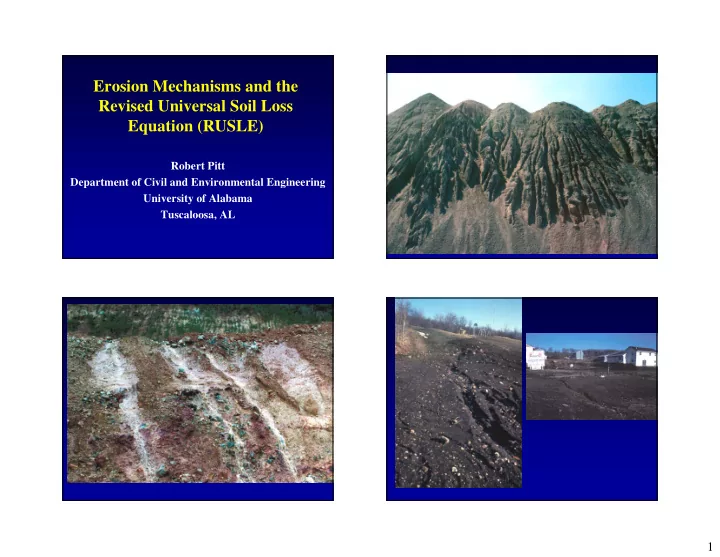
Erosion Mechanisms and the Revised Universal Soil Loss Equation (RUSLE) Robert Pitt Department of Civil and Environmental Engineering University of Alabama Tuscaloosa, AL 1 Raindrop Impact with Ground Surface Springer 1976 The Revised
Springer 1976
Springer 1976