Module 4: Erosion Mechanisms and the Revised Universal Soil Loss - - PowerPoint PPT Presentation
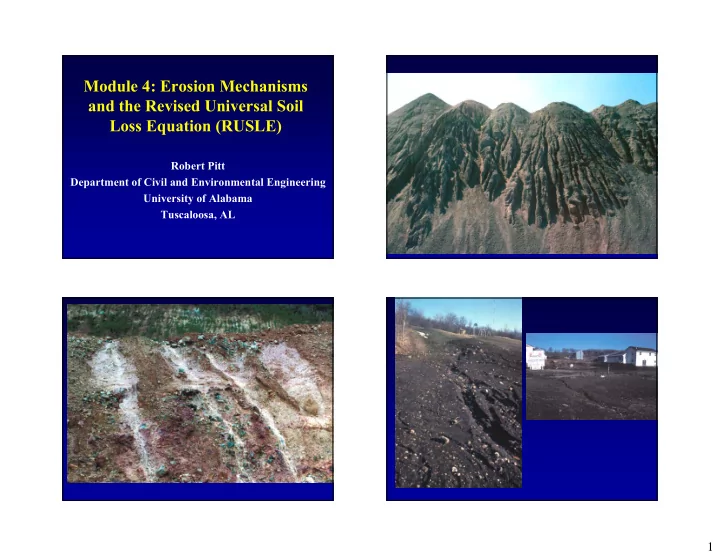
Module 4: Erosion Mechanisms and the Revised Universal Soil Loss Equation (RUSLE) Robert Pitt Department of Civil and Environmental Engineering University of Alabama Tuscaloosa, AL 1 Raindrop Impact with Ground Surface Springer 1976 The
2
Raindrop Impact with Ground Surface
Springer 1976
Typical Rain Drop Size Distribution
Springer 1976
The Revised Universal Soil Loss Equation (RUSLE)
(Renard, et al. 1987)
- The Revised Universal Soil Loss Equation (RUSLE) is
based on many thousands of test plot observations from throughout the US.
- RUSLE was developed in 1987 by the NRCS, and is
based on the earlier USLE published by the SCS in 1978.
- Typical uses of RUSLE for construction sites include:
– predicting the benefits of different management practices, – predicting the amounts of sediment that may be trapped in sediment ponds, and – determining maintenance schedules for different controls.
3
Revised Universal Soil Loss Equation
RUSLE predicts rill and interrill erosion (not channel scour):
A = (R)(K)(LS)(C)(P)
Where: A is the total soil loss, in tons per acre for the time period R is the rain energy factor for the time period K is the soil erodibility factor LS is the length-slope factor C is the degree of soil cover factor P is the conservation practices factor (for agricultural tillage and crop rotation operations, not generally applicable for construction site calculations) 1.02 Clay loams, sandy clays, and silty clays 0.87 Sand clay loam, silt loams, loams, and silty clay 0.70 Sands, loamy sands, sand loam Conversion Factor to Convert tons to cubic yards Soil Texture Class
acre yd acre tons
3
87 87 . 100 = × inches ft in yd ft ft acre acre yd 65 . 12 27 560 , 43 87
3 3 2 3
= × × ×
Soil Mass and Volume Conversions
( )( ) ⎥
⎦ ⎤ ⎢ ⎣ ⎡ =
∑ ∑
= = m k k n j
I E n R
1 30 1
1
Wischmeier (1959) found that the best predictor of R was: Where:
- E is the total storm kinetic energy in hundreds of ft-tons
per acre,
- I30 is the maximum 30-minute rainfall intensity,
- j is the counter for each year used to produce the average,
- k is the counter for the number of storms in a year,
- m is the number of storms n each year, and
- n is the number of years used to obtain the average R.
Wischmeier also found that the rain kinetic energy (E) could be predicted by: E = 916 + (331)log10 (I) where I is the average rain intensity (in/hr), and the units for E are ft-tons/acre per inch or rain
Rainfall Energy Index for Eastern US
4
Probabilities of Annual R Values
638 359 164 – 780 Montgomery 940 673 279 – 925 Mobile 592 354 179 – 601 Birmingham 5% probability 50% probability Observed 22 year range
Most of the eastern US has R values in the range of 50 to 150. The southeast values are from 300 to 700.
Single Storm Rain Energies (probabilities of single storm values in any one year and % of annual R for single storm)
172 (48%) 86 (24%) 62 (17%) Montgomery 194 (29%) 122 (21%) 97 (14%) Mobile 170 (48%) 77 (22%) 54 (15%) Birmingham 5% 50% 100%
Rainfall Erosion Index Zones for Southeast US Percentage of Annual Rainfall Erosivity Index for Different Time Periods in Alabama
3 2 October 1 to 15 9 8 July 1 to 15 4 5 April 1 to 15 3 % 3 % January 1 to 15 107 (central and south AL) 108 (northeast AL)
Not likely to meet the “R of 5” exclusion provision of NPDES in AL (a very short 2 week construction period would likely have an R of at least 10 and as high as 70).
5
5,000 2,300 1,200 Probable total erosion yield per time period (lb/acre): 8 4 2 Probable number of events per time period (out of 96): 92 70 45 600 1 77 50 29 1,200 2 55 31 17 1,800 3 31 16 8 3,000 5 12% 6% 3% 3,500 7% 30 days 14 days 7 days Probability of Event Occurring at Least Once per: Estimated Erosion Yield During Single Event Percentage
- f Annual
Erosion Yield During Event
Standard NRCS Soil Triangle
<0.00008 <0.002 <2 Clay 0.00008 to 0.002 0.002 to 0.05 2 to 50 Silt 0.002 to 0.08 0.05 to 2.00 50 to 2,000 Sand1 0.08 to 6 2 to 150 2,000 to 150,000 Gravel 6 to 12 in. 150 to 300 mm 150,000 to 300,000 µm Cobble inches millimeters micrometers Soil Particle Size Range
USDA Particle Size Ranges for Different Soil Texture Categories Generalized Soil Map for Alabama
6
Testing Characteristics of Suspended Solids for Erosion Control Design
2.7 19,600 39 Sullivan-State complex, 0 to 2% slopes 2.9 20,720 9 Bodine-Fullerton association, steep 3.1 21,990 18 Fullerton-urban land complex, 8 to 15% slopes 3.6 25,560 8 Bodine-Birmingham association, steep 3.6 25,870 40 Townley-Nauvoo complex, 8 to 15% slope 3.8 27,080 44 Urban land 4.1 29,390 35 Palmerdale complex, steep 6.2 44,010 34 Nauvoo-Montevallo association, steep 7.2 51,440 31 Nauvoo fine sandy loam, 8 to 15% slope 36.3 260,930 29 Montevallo-Nauvoo association, steep % Acres Map symbol Soil name
Area in Jefferson County: Ten Most Common Soils in Jefferson County, AL:
Erodibility Factors (k) for Typical Soils (most common soils in Jefferson County)
40 to 60 inches: 0.17 0 to 40 inches: 0.28 State 0 to 66 inches: 0.32 Sullivan 0 to 4 inches: 0.37 Townley No specific information Urban Land 0 to 60 inches: 0.24 Palmerdale 12 to 46 inches: 0.32 0 to 12 inches: 0.28 Nauvoo 6 to 16 inches: 0.32 0 to 6 inches: 0.37 Montevallo 6 to 35 inches: 0.24 0 to 6 inches: 0.28 Fullerton 0 to 72 inches: 0.28 Bodine 5 to 29 inches: 0.28 0 to 5 inches: 0.24 Birmingham Subsurface k values Surface k values Soil
7
General K values for soils having different textures (Dion 2002): Sandy, fine sand, loamy sand: 0.10 Loamy sand, loamy fine sand, sandy loam, loamy, silty loam: 0.15 Loamy, silty loam, sandy clay loam, fine sandy loam: 0.24 Silty clay loam, silty clay, clay, clay loam, loamy: 0.28
Length-Slope (LS) Factor
- The erosion of soil from a slope increases as
the slope increases and lengthens.
- RUSLE contains a table giving the LS factors
for different slopes and slope lengths.
- The slope length is the distance from the ridge
to the point where deposition starts to occur near the bottom of the slope.
8
Length-Slope Factor (cont.)
- A base condition of 1 corresponds to a slope
- f 9% and a length of 73 ft.
- If the length is 300 ft, or less, the LS factor is
less than 0.1 for all slopes of 0.5%, or less.
- Roadway cuts of 1:2 (50% slopes) would
have LS factors of >1 for all slope lengths of 6 ft, or longer.
- More than 80% of Jefferson County land has
slopes greater than 8%.
Selected LS Factors for RUSLE
22.57 8.23 1.60 0.43 0.06 300 ft 60.84 5.16 1.31 0.58 50% 20.57 2.10 0.67 0.41 20% 3.30 0.54 0.26 0.26 6% 0.69 0.21 0.13 0.13 2% 0.06 0.05 0.05 0.05 0.2% 1,000 ft 50 ft 9 ft <3 ft
Comparing Different Slope Design Options
53 10.6 150 (10) 53.6 22.57 300 50 44 6.0 150 (10) 26.8 10.81 300 25 39 1.9 150 (10) 10.7 3.09 300 10 26 0.51 150 (10) 3.2 0.69 300 3.0 5% 0.095 150 (10) ft. 0.54% 0.10 300 ft. 0.5% Estimated erosion reduction Approx. new LS factor Length (and terrace width) New slope LS factor Length Slope Alternative Terrace (1 mid-slope bench) Original Slope
Terracing to Reduce Slope Length (with slight increases in slope)
9
Cover Management Factor (C)
- Site preparations that remove all vegetation and root
zone material and leaves the soil completely without protection corresponds to the base condition of C = 1.
- Vegetation residue can be an effective erosion control.
- These can be applied as mechanical mulches (such as
chopped straw, wood chips, and even crushed stone).
- The lighter mulches needed to be secured with
chemical tacking agents or nettings on steep slopes or in areas subject to high winds.
- Erosion control blankets currently available can be
used in the most extreme cases, but are much more expensive.
- It is possible to calculate the shear stress for different
conditions and select the most cost-effective product.
Example Cover Management C Factors (and % control) for Different Materials
75 0.02 (98%) 34 to 50 25 Wood chips 50 0.08 (92%) 16 to 20 7 Wood chips 75 0.05 (95%) 34 to 50 135 Crushed stone 150 0.07 (93%) 11 to 15 2.0 Anchored straw 200 0.20 (80%) 1 to 5 1.0 Anchored straw Maximum slope length (ft) C factor (% control) Land slope (%) Mulch rate (tons/acre) Material
0.06 0.11 0.17 0.50 0.75 1.0 Seeding on an area where residual effects
- f prior
vegetation are no longer significant 0.06 0.11 0.17 0.42 0.62 0.79 Seeding on topsoil, without a mulch 75 to 96% 75 to 90% 75 to 80% 50 to 75% 10 to 50% 0 to 10% Crop canopy Period 3c (matur- ing crop) Period 3b (matur- ing crop) Period 3a (matur- ing crop) Period 2 (develop- ment) Period 1 (establish- ment) SB (seedbed preparation)
Cover Factor C Values for Different Growth Periods for Planted Cover Crops for Erosion Control at Construction Sites
0.011 0.038 0.09 0.17 Weeds 0.003 0.011 0.06 0.17 Grass 75 0.011 0.039 0.11 0.26 Weeds 0.003 0.012 0.07 0.26 Grass 50 0.011 0.041 0.13 0.36 Weeds 0.003 0.013 0.09 0.36 Grass 25 Tall weeds or short brush with average drop height of ≥20 inches 0.003 0.013 0.10 0.45 Grass Grass, grasslike plants, or decaying compacted plant litter. 95+ 80 40 0 % Plant type Percent cover
Cover Factor C for Established Plants (percent of surface covered by residue)
10
Example RUSLE Application
- Start and finish dates for each construction phase is
needed (to calculate R for the period).
- The surface soil K values are needed for each area.
- The LS factors need to be calculated for each area,
based on typical slopes and lengths
- The mulches or covers are needed. In this example
these are:
– Erosion control mats for road cuts – Planted vegetation or tacked mulches on embankment – Gravel pads for parking and road surfaces 1) install downslope sediment controls (filter fencing and sediment ponds) 2) install upslope diversions and protect on-site channels that will remain (diversion berms and swales, channel lining, establish buffers, and filter fencing) 3) first area clearing and grubbing (minimize area exposed and time to complete phase) 4) first area final contouring (stabilize exposed areas before moving on to next area)
The basic time phases of interest for erosion evaluation and control may include the following:
5) repeat above 2 steps for all other areas, dividing the whole planned disturbed construction site into areas as small as possible (some states restrict the area disturbed to be < 5 acres at any one time) 6) establish roadways and parking areas and install utilities (leaving road bed base, or preliminary pavement, protect inlets, etc.) 7) building erection (provide adequate storage for materials and for construction vehicle parking, practice good housekeeping, etc.) 8) final landscaping (remove temporary controls, replace with permanent stormwater facilities, irrigate vegetation until established)
Example Simple Application of RUSLE at Construction Site
12.65 14.34 Total 0.23 0.02 0.22 0.28 196 0.95 Road segment 0.69 0.02 0.06 0.28 196 10.5 Parking area 10.14 0.55 0.40 0.28 196 0.84 Embankment 1.58 0.02 2.67 0.28 196 0.54 Road cut 0.01 0.001 0.30 0.15 196 1.51 Undisturbed area Calc soil loss (tons/period) C LS K R (Mar 5 to Jul 31) Area (acres)
11
Summary of RUSLE Application
- In this example application, the March 5 to July 31
construction phase for these stabilized areas would produce only about 13 tons of sediment. If there were no ground cover controls, the expected losses would be about 150 tons, for a calculated level of control of about 90%.
- Other construction periods may be less well
controlled due to on-going grading operations.
- RUSLE can be used to estimate the level of
performance expected for different alternatives, and to calculate the amount of sediment that may be expected to leave the site.
Selecting Plants for Erosion Control
In Georgia, the legend says That you must close your windows At night to keep it out of the house. The glass is tinged with green, even so... From the poem, Kudzu, by James Dickey 3 5
- ver 10
4 6 5-10 5 7 0-5 Kentucky Bluegrass 4 6
- ver 10
5 7 5-10 6 8 0-5 Bermudagrass Easily Eroded Soils maximum permissible velocity (ft/s) Erosion Resistant Soils maximum permissible velocity (ft/s) Slope Range Cover
Selection of Grasses for Channel Linings
12
Sep 15-Nov 15 Sep 15-Nov 15 Sep 1-Nov 1 3 bu Wheat Apr 1-Aug 15 Apr 15-Aug 1 May 1-Aug 1 40 lbs Sudangrass Apr 1-Aug 15 Apr 15-Aug 1 May 1-Aug 1 40 lbs Sorghum- Sudan Hybrids Sep 1 -Oct 15 Sep 1-Oct 15 Aug 1-Sep 15 30 lbs Ryegrass Sep 15-Nov 15 Sep 15-Nov 15 Sep 1-Nov 15 3 bu Rye Apr 1-Aug 15 Apr 1-Aug 15 May 1-Aug 1 40 lbs Millet, Browntop or German South Alabama Central Alabama North Alabama Seeding Rate/Ac Species Seeding Dates
Commonly Used Plants for Temporary Cover
Feb 15-July 15 Mar 1-July 15 Mar 15-July 15 40-60 lbs 10 lbs Sericea & Common Bermudagrass
- Sep 1-Nov 1
Sep 1-Nov 1 40-50 lbs Fescue, Tall Feb 15-Sep 1 Mar 1-Aug 1 Mar 1-Aug 1 Sprigs 1/sq ft Bermudagrass, Hybrid (Lawn Types) Mar 1-July 15 Mar 1-July l
- 30 lbs
5 lbs Bahiagrass, Pensacola Common Bermudagrass Mar 1-July 15 Mar 15-July 15 Apr 1-July 1 10 lbs Bermudagrass, Common Feb 1-Nov 1* Mar l-July 1
- 40 1bs
Bahiagrass, Pensacola South Alabama Central Alabama North Alabama Seeding Rates/Ac Species Seeding Dates & Adapted Area
Perennial Plants, Seeding Rates, and Planting Dates
good excel. fair good fair Zoysia poor poor poor good good
- St. Augustine
good good good fair good Tall fescue poor good poor good fair Centipede good excel. poor good fair Bahiagrass excel. excel. poor good no Bermudagrass Wear Drought Cold Heat Shade Grass Adaptation
Characteristics of Grasses Used as Sod in Alabama
Poor Mulch Cover Good Mulch Cover 10 to 20 tons/acre Peanut hulls 1 to 2 tons/acre Pine straw 35 cu yds/acre Bark 5 to 6 tons/acre Wood chips 1-1/2 to 2 tons/acre Straw
Typical Mulching Materials and Application Rates:
13
Homework Assignment
1) Describe the different construction phases for your site (initial grubbing and clearing, using pre-development contours; and final grading contours during active construction activities, at least). Describe site soils and land cover. Describe the timing of the construction site erosion and sediment controls for your site. 2) Apply RUSLE for each of these phases (apply estimates for cover factors and durations of the phases; we will examine channels and slope protection during the next module, so this assignment will be a preliminary evaluation. However, consider different terracing
- ptions and other control choices described so far).